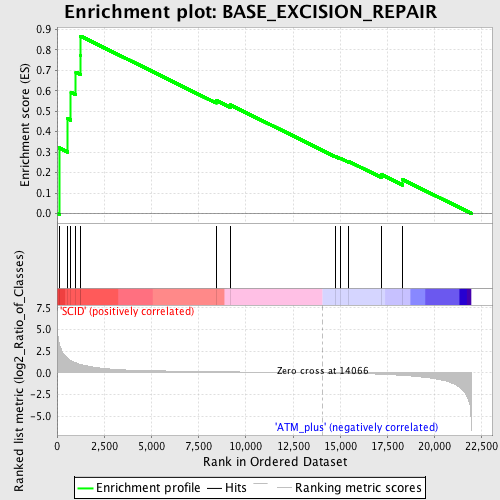
Profile of the Running ES Score & Positions of GeneSet Members on the Rank Ordered List
| Dataset | Set_01_SCID_versus_ATM_plus.phenotype_SCID_versus_ATM_plus.cls #SCID_versus_ATM_plus.phenotype_SCID_versus_ATM_plus.cls #SCID_versus_ATM_plus_repos |
| Phenotype | phenotype_SCID_versus_ATM_plus.cls#SCID_versus_ATM_plus_repos |
| Upregulated in class | SCID |
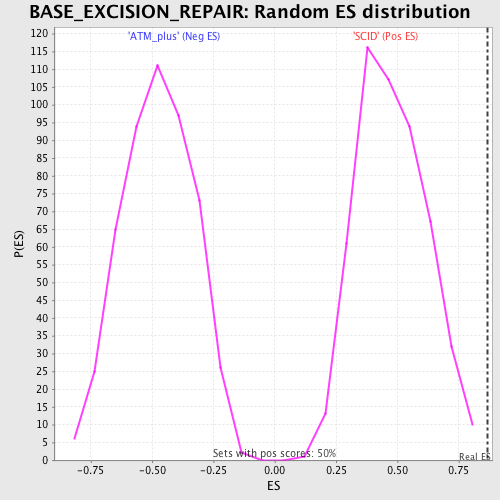
| GeneSet | BASE_EXCISION_REPAIR |
| Enrichment Score (ES) | 0.8672636 |
| Normalized Enrichment Score (NES) | 1.8196676 |
| Nominal p-value | 0.0 |
| FDR q-value | 0.03933095 |
| FWER p-Value | 0.191 |
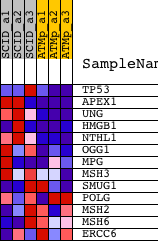
| PROBE | DESCRIPTION (from dataset) | GENE SYMBOL | GENE_TITLE | RANK IN GENE LIST | RANK METRIC SCORE | RUNNING ES | CORE ENRICHMENT | |
|---|---|---|---|---|---|---|---|---|
| 1 | TP53 | 1426538_a_at 1427739_a_at 1438808_at 1457623_x_at 1459780_at 1459781_x_at | 111 | 3.368 | 0.3209 | Yes | ||
| 2 | APEX1 | 1416135_at 1437715_x_at 1456079_x_at | 567 | 1.683 | 0.4630 | Yes | ||
| 3 | UNG | 1425753_a_at | 734 | 1.410 | 0.5919 | Yes | ||
| 4 | HMGB1 | 1416176_at 1425048_a_at 1435324_x_at | 997 | 1.148 | 0.6911 | Yes | ||
| 5 | NTHL1 | 1419433_at | 1237 | 0.971 | 0.7742 | Yes | ||
| 6 | OGG1 | 1430078_a_at 1448815_at | 1247 | 0.966 | 0.8673 | Yes | ||
| 7 | MPG | 1417571_at 1417572_at 1442302_at | 8421 | 0.138 | 0.5535 | No | ||
| 8 | MSH3 | 1422261_a_at 1424166_at 1430643_at 1446511_at | 9173 | 0.120 | 0.5308 | No | ||
| 9 | SMUG1 | 1428763_at | 14756 | -0.022 | 0.2783 | No | ||
| 10 | POLG | 1423272_at 1423273_at 1437564_at | 15012 | -0.030 | 0.2696 | No | ||
| 11 | MSH2 | 1416988_at 1447888_x_at | 15440 | -0.046 | 0.2546 | No | ||
| 12 | MSH6 | 1416915_at | 17164 | -0.149 | 0.1904 | No | ||
| 13 | ERCC6 | 1441595_at 1442604_at | 18298 | -0.281 | 0.1659 | No |