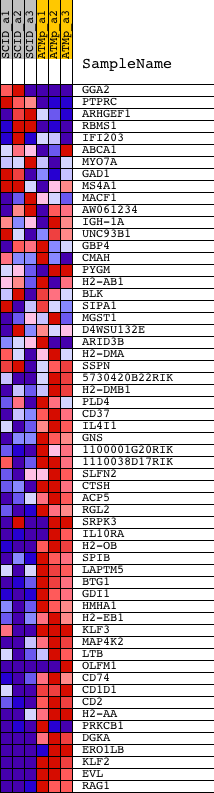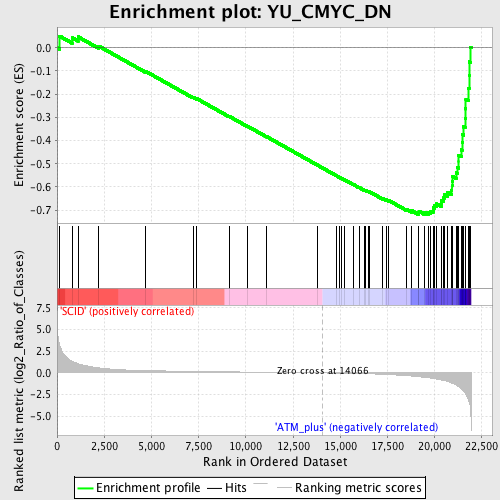
Profile of the Running ES Score & Positions of GeneSet Members on the Rank Ordered List
| Dataset | Set_01_SCID_versus_ATM_plus.phenotype_SCID_versus_ATM_plus.cls #SCID_versus_ATM_plus.phenotype_SCID_versus_ATM_plus.cls #SCID_versus_ATM_plus_repos |
| Phenotype | phenotype_SCID_versus_ATM_plus.cls#SCID_versus_ATM_plus_repos |
| Upregulated in class | ATM_plus |
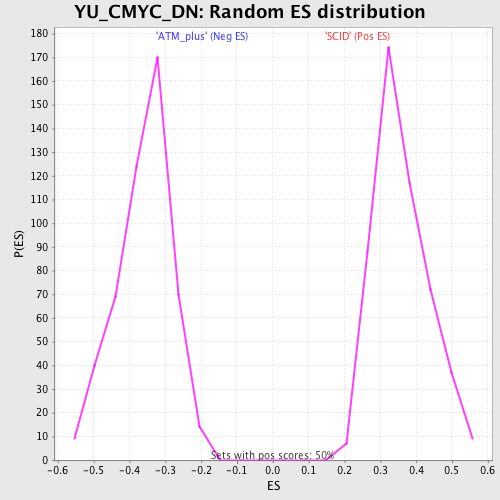
| GeneSet | YU_CMYC_DN |
| Enrichment Score (ES) | -0.71881866 |
| Normalized Enrichment Score (NES) | -2.0114758 |
| Nominal p-value | 0.0 |
| FDR q-value | 0.0020305975 |
| FWER p-Value | 0.0020 |
| PROBE | DESCRIPTION (from dataset) | GENE SYMBOL | GENE_TITLE | RANK IN GENE LIST | RANK METRIC SCORE | RUNNING ES | CORE ENRICHMENT | |
|---|---|---|---|---|---|---|---|---|
| 1 | GGA2 | 1428141_at 1457955_at | 131 | 3.229 | 0.0503 | No | ||
| 2 | PTPRC | 1422124_a_at 1440165_at | 795 | 1.337 | 0.0433 | No | ||
| 3 | ARHGEF1 | 1421164_a_at 1440403_at | 1111 | 1.053 | 0.0472 | No | ||
| 4 | RBMS1 | 1418703_at 1434005_at 1441437_at 1458578_at 1459968_at | 2213 | 0.577 | 0.0069 | No | ||
| 5 | IFI203 | 1419858_at 1425008_a_at 1426906_at 1442828_at 1448775_at 1451567_a_at 1452231_x_at | 4661 | 0.269 | -0.1002 | No | ||
| 6 | ABCA1 | 1421839_at 1421840_at 1450392_at | 7199 | 0.173 | -0.2132 | No | ||
| 7 | MYO7A | 1421385_a_at | 7393 | 0.167 | -0.2191 | No | ||
| 8 | GAD1 | 1416561_at 1416562_at | 9116 | 0.121 | -0.2957 | No | ||
| 9 | MS4A1 | 1423226_at 1450912_at | 10091 | 0.098 | -0.3385 | No | ||
| 10 | MACF1 | 1428847_a_at 1428848_a_at 1439582_at | 11105 | 0.074 | -0.3835 | No | ||
| 11 | AW061234 | 1454984_at | 13795 | 0.007 | -0.5063 | No | ||
| 12 | IGH-1A | 1425385_a_at 1426196_at 1451632_a_at 1452535_at 1452538_at 1455530_at | 14775 | -0.022 | -0.5507 | No | ||
| 13 | UNC93B1 | 1423768_at | 14981 | -0.029 | -0.5595 | No | ||
| 14 | GBP4 | 1418392_a_at | 15049 | -0.031 | -0.5621 | No | ||
| 15 | CMAH | 1421214_at 1428043_a_at 1440458_at 1440517_x_at 1447019_at 1447502_at | 15233 | -0.038 | -0.5698 | No | ||
| 16 | PYGM | 1448602_at | 15711 | -0.056 | -0.5906 | No | ||
| 17 | H2-AB1 | 1425477_x_at 1450648_s_at 1451721_a_at | 16005 | -0.071 | -0.6027 | No | ||
| 18 | BLK | 1422775_at | 16285 | -0.085 | -0.6140 | No | ||
| 19 | SIPA1 | 1416206_at | 16310 | -0.086 | -0.6136 | No | ||
| 20 | MGST1 | 1415897_a_at 1415898_at | 16480 | -0.097 | -0.6196 | No | ||
| 21 | D4WSU132E | 1417321_at | 16559 | -0.103 | -0.6214 | No | ||
| 22 | ARID3B | 1423526_at 1447626_x_at | 17240 | -0.155 | -0.6498 | No | ||
| 23 | H2-DMA | 1422527_at 1459872_x_at | 17427 | -0.173 | -0.6553 | No | ||
| 24 | SSPN | 1417644_at 1417645_at | 17564 | -0.186 | -0.6582 | No | ||
| 25 | 5730420B22RIK | 1427050_at | 18489 | -0.305 | -0.6952 | No | ||
| 26 | H2-DMB1 | 1418638_at 1443686_at 1443687_x_at | 18783 | -0.352 | -0.7024 | No | ||
| 27 | PLD4 | 1433678_at | 19129 | -0.422 | -0.7108 | Yes | ||
| 28 | CD37 | 1419206_at 1425736_at | 19166 | -0.432 | -0.7050 | Yes | ||
| 29 | IL4I1 | 1419192_at | 19449 | -0.495 | -0.7092 | Yes | ||
| 30 | GNS | 1433488_x_at 1433546_at 1446861_at | 19660 | -0.553 | -0.7092 | Yes | ||
| 31 | 1100001G20RIK | 1434484_at | 19792 | -0.591 | -0.7049 | Yes | ||
| 32 | 1110038D17RIK | 1428071_at | 19913 | -0.627 | -0.6994 | Yes | ||
| 33 | SLFN2 | 1450165_at | 19928 | -0.633 | -0.6890 | Yes | ||
| 34 | CTSH | 1418365_at 1443814_x_at | 19994 | -0.656 | -0.6806 | Yes | ||
| 35 | ACP5 | 1431609_a_at | 20100 | -0.698 | -0.6732 | Yes | ||
| 36 | RGL2 | 1450688_at | 20345 | -0.796 | -0.6705 | Yes | ||
| 37 | SRPK3 | 1418798_s_at 1431825_at 1432139_at 1447806_s_at | 20370 | -0.808 | -0.6575 | Yes | ||
| 38 | IL10RA | 1437808_x_at 1448731_at 1456173_at | 20476 | -0.860 | -0.6473 | Yes | ||
| 39 | H2-OB | 1440837_at | 20500 | -0.870 | -0.6332 | Yes | ||
| 40 | SPIB | 1460407_at | 20683 | -0.979 | -0.6245 | Yes | ||
| 41 | LAPTM5 | 1426025_s_at 1436905_x_at 1447742_at 1459841_x_at | 20894 | -1.142 | -0.6142 | Yes | ||
| 42 | BTG1 | 1426083_a_at 1437455_a_at | 20915 | -1.159 | -0.5949 | Yes | ||
| 43 | GDI1 | 1447613_at 1451070_at | 20922 | -1.166 | -0.5748 | Yes | ||
| 44 | HMHA1 | 1428242_at | 20947 | -1.191 | -0.5552 | Yes | ||
| 45 | H2-EB1 | 1417025_at | 21137 | -1.404 | -0.5394 | Yes | ||
| 46 | KLF3 | 1421604_a_at 1429360_at 1431630_a_at 1441200_at 1442920_at 1454666_at | 21192 | -1.484 | -0.5160 | Yes | ||
| 47 | MAP4K2 | 1428297_at 1434833_at 1450244_a_at | 21264 | -1.570 | -0.4918 | Yes | ||
| 48 | LTB | 1419135_at | 21266 | -1.571 | -0.4645 | Yes | ||
| 49 | OLFM1 | 1425784_a_at 1426562_a_at 1440115_at 1455796_x_at | 21404 | -1.807 | -0.4393 | Yes | ||
| 50 | CD74 | 1425519_a_at | 21451 | -1.914 | -0.4081 | Yes | ||
| 51 | CD1D1 | 1449130_at 1449131_s_at | 21480 | -1.981 | -0.3748 | Yes | ||
| 52 | CD2 | 1418770_at | 21523 | -2.075 | -0.3406 | Yes | ||
| 53 | H2-AA | 1435290_x_at 1438858_x_at 1443783_x_at | 21611 | -2.317 | -0.3042 | Yes | ||
| 54 | PRKCB1 | 1423478_at 1438981_at 1443144_at 1459674_at 1460419_a_at | 21636 | -2.405 | -0.2634 | Yes | ||
| 55 | DGKA | 1418578_at | 21651 | -2.462 | -0.2211 | Yes | ||
| 56 | ERO1LB | 1425705_a_at 1434714_at 1449948_at | 21785 | -3.050 | -0.1741 | Yes | ||
| 57 | KLF2 | 1448890_at | 21824 | -3.304 | -0.1182 | Yes | ||
| 58 | EVL | 1434920_a_at 1440885_at 1445957_at 1450106_a_at 1456453_at 1458889_at | 21833 | -3.335 | -0.0605 | Yes | ||
| 59 | RAG1 | 1440574_at 1450680_at | 21883 | -3.739 | 0.0024 | Yes |