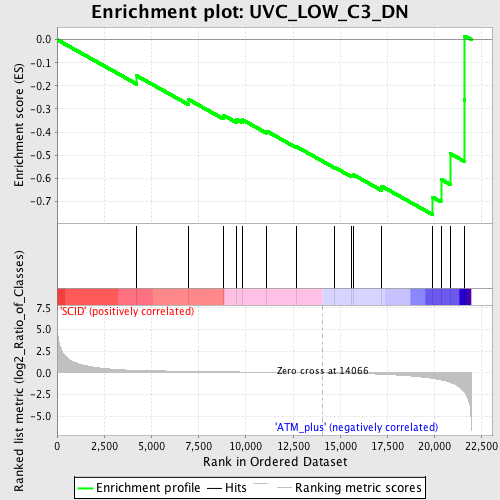
Profile of the Running ES Score & Positions of GeneSet Members on the Rank Ordered List
| Dataset | Set_01_SCID_versus_ATM_plus.phenotype_SCID_versus_ATM_plus.cls #SCID_versus_ATM_plus.phenotype_SCID_versus_ATM_plus.cls #SCID_versus_ATM_plus_repos |
| Phenotype | phenotype_SCID_versus_ATM_plus.cls#SCID_versus_ATM_plus_repos |
| Upregulated in class | ATM_plus |
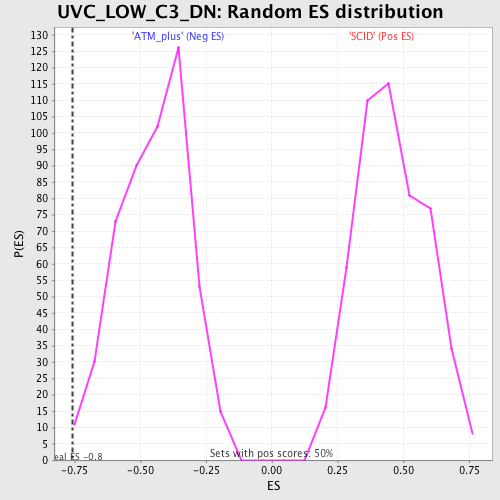
| GeneSet | UVC_LOW_C3_DN |
| Enrichment Score (ES) | -0.75732225 |
| Normalized Enrichment Score (NES) | -1.6887566 |
| Nominal p-value | 0.0060 |
| FDR q-value | 0.17131293 |
| FWER p-Value | 0.941 |
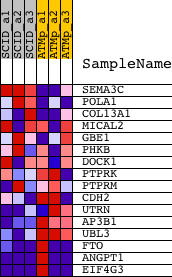
| PROBE | DESCRIPTION (from dataset) | GENE SYMBOL | GENE_TITLE | RANK IN GENE LIST | RANK METRIC SCORE | RUNNING ES | CORE ENRICHMENT | |
|---|---|---|---|---|---|---|---|---|
| 1 | SEMA3C | 1420696_at 1429348_at | 4220 | 0.294 | -0.1563 | No | ||
| 2 | POLA1 | 1419397_at 1456285_at 1459319_at 1459963_at | 6944 | 0.180 | -0.2584 | No | ||
| 3 | COL13A1 | 1422866_at | 8805 | 0.129 | -0.3273 | No | ||
| 4 | MICAL2 | 1438726_at 1455685_at | 9497 | 0.112 | -0.3450 | No | ||
| 5 | GBE1 | 1420654_a_at 1458767_at | 9834 | 0.103 | -0.3476 | No | ||
| 6 | PHKB | 1434511_at 1442053_at | 11097 | 0.074 | -0.3961 | No | ||
| 7 | DOCK1 | 1443390_at 1443760_at 1443991_at 1452220_at 1457806_at | 12664 | 0.037 | -0.4629 | No | ||
| 8 | PTPRK | 1423277_at 1423278_at 1431680_a_at 1441276_at 1441277_s_at 1441644_at 1443491_at 1443699_at 1444763_at | 14713 | -0.021 | -0.5538 | No | ||
| 9 | PTPRM | 1422541_at 1441199_at | 15601 | -0.052 | -0.5879 | No | ||
| 10 | CDH2 | 1418815_at 1439307_at 1449244_at | 15676 | -0.055 | -0.5845 | No | ||
| 11 | UTRN | 1426892_at 1427569_a_at 1441038_at 1441153_at 1447555_at 1452222_at 1457505_at 1459009_at | 17190 | -0.151 | -0.6349 | No | ||
| 12 | AP3B1 | 1423235_at 1450915_at | 19874 | -0.614 | -0.6817 | Yes | ||
| 13 | UBL3 | 1423461_a_at | 20334 | -0.793 | -0.6049 | Yes | ||
| 14 | FTO | 1430829_s_at 1448223_at | 20830 | -1.085 | -0.4938 | Yes | ||
| 15 | ANGPT1 | 1421441_at 1438936_s_at 1438937_x_at 1439066_at 1446656_at 1450717_at 1457381_at | 21555 | -2.161 | -0.2605 | Yes | ||
| 16 | EIF4G3 | 1426833_at 1430578_at 1440571_at 1445616_at 1446145_at | 21596 | -2.254 | 0.0155 | Yes |