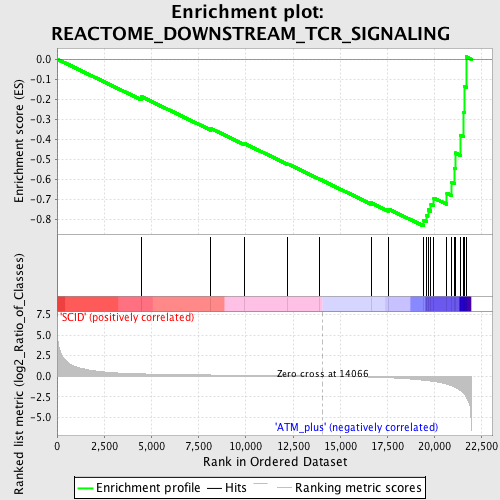
Profile of the Running ES Score & Positions of GeneSet Members on the Rank Ordered List
| Dataset | Set_01_SCID_versus_ATM_plus.phenotype_SCID_versus_ATM_plus.cls #SCID_versus_ATM_plus.phenotype_SCID_versus_ATM_plus.cls #SCID_versus_ATM_plus_repos |
| Phenotype | phenotype_SCID_versus_ATM_plus.cls#SCID_versus_ATM_plus_repos |
| Upregulated in class | ATM_plus |
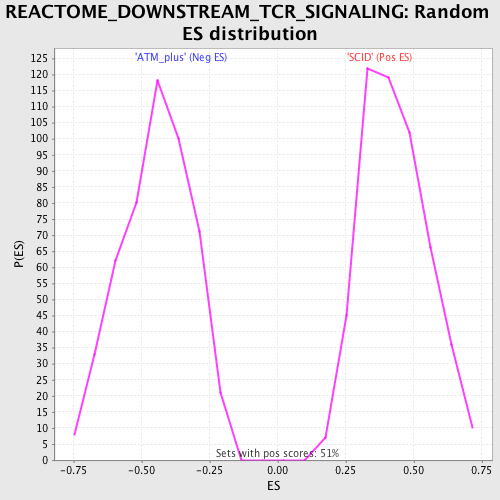
| GeneSet | REACTOME_DOWNSTREAM_TCR_SIGNALING |
| Enrichment Score (ES) | -0.834012 |
| Normalized Enrichment Score (NES) | -1.875053 |
| Nominal p-value | 0.0 |
| FDR q-value | 0.021621382 |
| FWER p-Value | 0.048 |
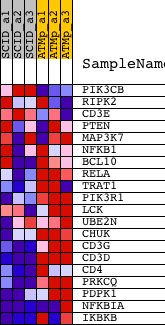
| PROBE | DESCRIPTION (from dataset) | GENE SYMBOL | GENE_TITLE | RANK IN GENE LIST | RANK METRIC SCORE | RUNNING ES | CORE ENRICHMENT | |
|---|---|---|---|---|---|---|---|---|
| 1 | PIK3CB | 1445731_at 1453069_at | 4470 | 0.277 | -0.1876 | No | ||
| 2 | RIPK2 | 1421236_at 1450173_at | 8147 | 0.145 | -0.3468 | No | ||
| 3 | CD3E | 1422105_at 1445748_at | 9934 | 0.101 | -0.4224 | No | ||
| 4 | PTEN | 1422553_at 1441593_at 1444325_at 1450655_at 1454722_at 1455728_at 1457493_at | 12225 | 0.047 | -0.5241 | No | ||
| 5 | MAP3K7 | 1419988_at 1425795_a_at 1426627_at 1449693_at 1455441_at 1458787_at | 13897 | 0.005 | -0.6001 | No | ||
| 6 | NFKB1 | 1427705_a_at 1442949_at | 16630 | -0.107 | -0.7184 | No | ||
| 7 | BCL10 | 1418970_a_at 1418971_x_at 1418972_at 1443524_x_at | 17549 | -0.185 | -0.7495 | No | ||
| 8 | RELA | 1419536_a_at | 19403 | -0.485 | -0.8055 | Yes | ||
| 9 | TRAT1 | 1427532_at 1437561_at | 19578 | -0.532 | -0.7822 | Yes | ||
| 10 | PIK3R1 | 1425514_at 1425515_at 1438682_at 1444591_at 1451737_at | 19644 | -0.549 | -0.7529 | Yes | ||
| 11 | LCK | 1425396_a_at 1439145_at 1439146_s_at 1457917_at | 19798 | -0.593 | -0.7250 | Yes | ||
| 12 | UBE2N | 1422559_at 1435384_at | 19955 | -0.642 | -0.6944 | Yes | ||
| 13 | CHUK | 1417091_at 1428210_s_at 1451383_a_at | 20646 | -0.945 | -0.6704 | Yes | ||
| 14 | CD3G | 1419178_at | 20877 | -1.120 | -0.6151 | Yes | ||
| 15 | CD3D | 1422828_at | 21050 | -1.299 | -0.5466 | Yes | ||
| 16 | CD4 | 1419696_at 1427779_a_at | 21103 | -1.360 | -0.4690 | Yes | ||
| 17 | PRKCQ | 1426044_a_at | 21352 | -1.700 | -0.3804 | Yes | ||
| 18 | PDPK1 | 1415729_at 1416501_at 1459775_at 1459776_x_at | 21531 | -2.098 | -0.2652 | Yes | ||
| 19 | NFKBIA | 1420088_at 1420089_at 1438157_s_at 1448306_at 1449731_s_at | 21592 | -2.242 | -0.1362 | Yes | ||
| 20 | IKBKB | 1426207_at 1426333_a_at 1432275_at 1445141_at 1454184_a_at | 21683 | -2.583 | 0.0115 | Yes |