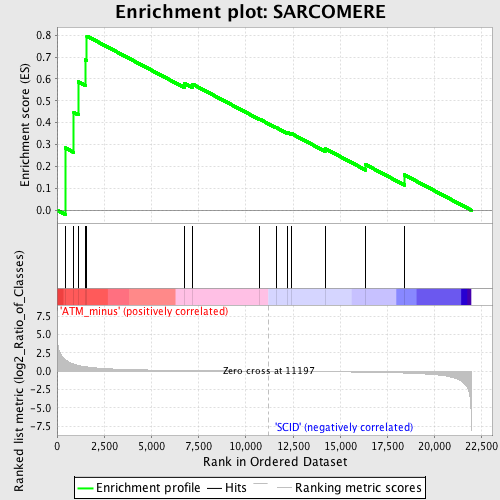
Profile of the Running ES Score & Positions of GeneSet Members on the Rank Ordered List
| Dataset | Set_01_ATM_minus_versus_SCID.phenotype_ATM_minus_versus_SCID.cls #ATM_minus_versus_SCID |
| Phenotype | phenotype_ATM_minus_versus_SCID.cls#ATM_minus_versus_SCID |
| Upregulated in class | ATM_minus |
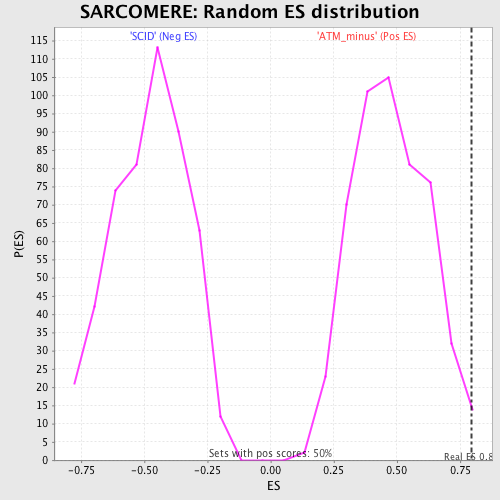
| GeneSet | SARCOMERE |
| Enrichment Score (ES) | 0.7959931 |
| Normalized Enrichment Score (NES) | 1.6708989 |
| Nominal p-value | 0.011904762 |
| FDR q-value | 1.0 |
| FWER p-Value | 0.956 |
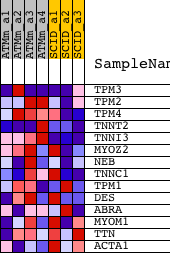
| PROBE | DESCRIPTION (from dataset) | GENE SYMBOL | GENE_TITLE | RANK IN GENE LIST | RANK METRIC SCORE | RUNNING ES | CORE ENRICHMENT | |
|---|---|---|---|---|---|---|---|---|
| 1 | TPM3 | 1427260_a_at 1427567_a_at 1436958_x_at 1449996_a_at 1449997_at | 430 | 1.601 | 0.2847 | Yes | ||
| 2 | TPM2 | 1419738_a_at 1419739_at 1425028_a_at 1449577_x_at | 888 | 0.963 | 0.4471 | Yes | ||
| 3 | TPM4 | 1433883_at | 1125 | 0.791 | 0.5868 | Yes | ||
| 4 | TNNT2 | 1418726_a_at 1424967_x_at 1440424_at | 1498 | 0.618 | 0.6872 | Yes | ||
| 5 | TNNI3 | 1422536_at | 1578 | 0.591 | 0.7960 | Yes | ||
| 6 | MYOZ2 | 1418769_at | 6737 | 0.099 | 0.5796 | No | ||
| 7 | NEB | 1435355_at | 7179 | 0.087 | 0.5760 | No | ||
| 8 | TNNC1 | 1418370_at | 10711 | 0.010 | 0.4169 | No | ||
| 9 | TPM1 | 1423049_a_at 1423721_at 1447713_at 1456623_at | 11607 | -0.009 | 0.3778 | No | ||
| 10 | DES | 1426731_at | 12192 | -0.021 | 0.3552 | No | ||
| 11 | ABRA | 1458455_at | 12424 | -0.026 | 0.3496 | No | ||
| 12 | MYOM1 | 1420693_at | 14195 | -0.067 | 0.2815 | No | ||
| 13 | TTN | 1427445_a_at 1427446_s_at 1431928_at 1444083_at 1444638_at 1446450_at | 16346 | -0.131 | 0.2083 | No | ||
| 14 | ACTA1 | 1427735_a_at | 18396 | -0.245 | 0.1615 | No |