Profile of the Running ES Score & Positions of GeneSet Members on the Rank Ordered List
| Dataset | Set_01_ATM_minus_versus_SCID.phenotype_ATM_minus_versus_SCID.cls #ATM_minus_versus_SCID |
| Phenotype | phenotype_ATM_minus_versus_SCID.cls#ATM_minus_versus_SCID |
| Upregulated in class | SCID |
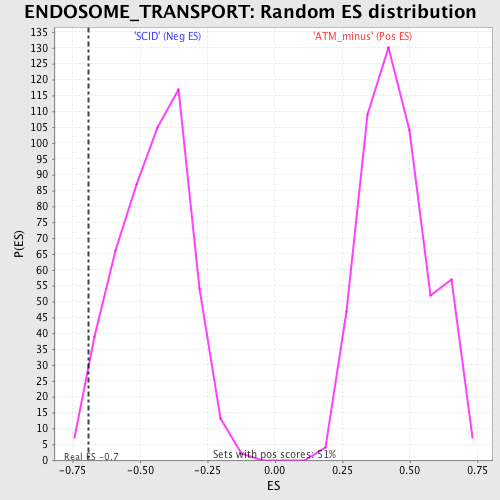
| GeneSet | ENDOSOME_TRANSPORT |
| Enrichment Score (ES) | -0.6900757 |
| Normalized Enrichment Score (NES) | -1.5333797 |
| Nominal p-value | 0.024489796 |
| FDR q-value | 1.0 |
| FWER p-Value | 1.0 |
| PROBE | DESCRIPTION (from dataset) | GENE SYMBOL | GENE_TITLE | RANK IN GENE LIST | RANK METRIC SCORE | RUNNING ES | CORE ENRICHMENT | |
|---|---|---|---|---|---|---|---|---|
| 1 | RHOB | 1449110_at | 878 | 0.975 | 0.0430 | No | ||
| 2 | VTI1A | 1419189_at 1419190_at 1439876_at 1445374_at 1446365_at 1454077_at | 5332 | 0.145 | -0.1478 | No | ||
| 3 | EEA1 | 1438045_at | 7918 | 0.069 | -0.2599 | No | ||
| 4 | ZFYVE16 | 1447947_at | 8625 | 0.053 | -0.2876 | No | ||
| 5 | ADRB2 | 1437302_at | 12302 | -0.023 | -0.4533 | No | ||
| 6 | YKT6 | 1448464_at 1460191_at | 14130 | -0.065 | -0.5311 | No | ||
| 7 | LYST | 1421384_at 1425973_at 1434674_at | 14654 | -0.079 | -0.5482 | No | ||
| 8 | STX16 | 1429237_at | 14966 | -0.088 | -0.5549 | No | ||
| 9 | M6PR | 1416385_a_at 1416386_a_at | 15382 | -0.100 | -0.5654 | No | ||
| 10 | ABCA1 | 1421839_at 1421840_at 1450392_at | 16324 | -0.130 | -0.5973 | No | ||
| 11 | DOPEY2 | 1428330_at 1449904_at | 16500 | -0.136 | -0.5937 | No | ||
| 12 | RAB35 | 1433922_at | 18079 | -0.220 | -0.6469 | Yes | ||
| 13 | VPS4B | 1417007_a_at 1457067_at 1460104_at | 18390 | -0.245 | -0.6401 | Yes | ||
| 14 | MON2 | 1428817_at 1428818_at | 18754 | -0.280 | -0.6329 | Yes | ||
| 15 | DOPEY1 | 1435295_at 1442855_at | 19111 | -0.318 | -0.6220 | Yes | ||
| 16 | RAB14 | 1415686_at 1419243_at 1419244_a_at 1419245_at 1419246_s_at 1439687_at 1441992_at | 20604 | -0.653 | -0.6344 | Yes | ||
| 17 | GOSR1 | 1416215_at 1448256_at | 21013 | -0.900 | -0.5763 | Yes | ||
| 18 | SQSTM1 | 1440076_at 1442237_at 1444021_at 1450957_a_at | 21090 | -0.971 | -0.4970 | Yes | ||
| 19 | BET1L | 1422980_a_at 1426372_a_at 1430549_at 1453570_x_at | 21452 | -1.436 | -0.3911 | Yes | ||
| 20 | STX5 | 1419952_at 1448267_at 1449679_s_at | 21657 | -1.919 | -0.2368 | Yes | ||
| 21 | ANKRD27 | 1425112_at 1454717_at | 21834 | -2.927 | 0.0047 | Yes |