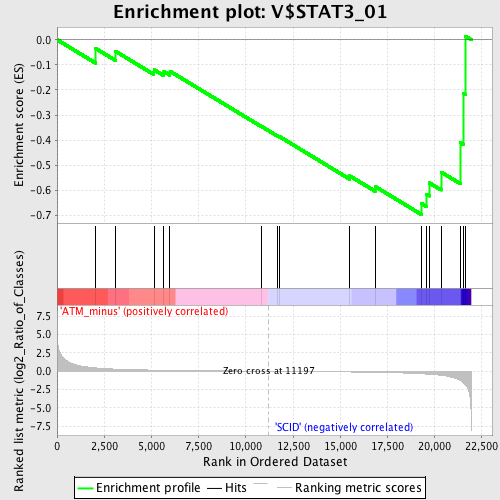
Profile of the Running ES Score & Positions of GeneSet Members on the Rank Ordered List
| Dataset | Set_01_ATM_minus_versus_SCID.phenotype_ATM_minus_versus_SCID.cls #ATM_minus_versus_SCID |
| Phenotype | phenotype_ATM_minus_versus_SCID.cls#ATM_minus_versus_SCID |
| Upregulated in class | SCID |
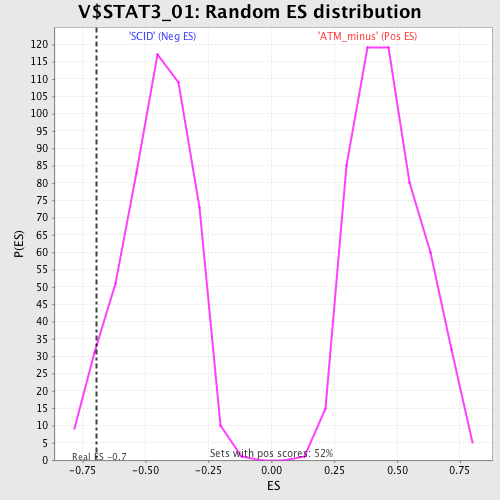
| GeneSet | V$STAT3_01 |
| Enrichment Score (ES) | -0.6961803 |
| Normalized Enrichment Score (NES) | -1.5293396 |
| Nominal p-value | 0.04752066 |
| FDR q-value | 0.3639755 |
| FWER p-Value | 0.811 |
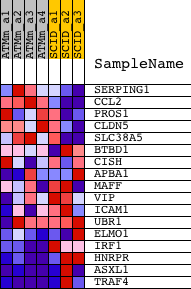
| PROBE | DESCRIPTION (from dataset) | GENE SYMBOL | GENE_TITLE | RANK IN GENE LIST | RANK METRIC SCORE | RUNNING ES | CORE ENRICHMENT | |
|---|---|---|---|---|---|---|---|---|
| 1 | SERPING1 | 1416625_at | 2041 | 0.459 | -0.0345 | No | ||
| 2 | CCL2 | 1420380_at | 3103 | 0.287 | -0.0462 | No | ||
| 3 | PROS1 | 1426246_at | 5131 | 0.153 | -0.1192 | No | ||
| 4 | CLDN5 | 1417839_at | 5657 | 0.133 | -0.1262 | No | ||
| 5 | SLC38A5 | 1454622_at | 5977 | 0.122 | -0.1253 | No | ||
| 6 | BTBD1 | 1445646_at 1455286_at 1456222_at | 10815 | 0.008 | -0.3449 | No | ||
| 7 | CISH | 1448724_at | 11676 | -0.010 | -0.3828 | No | ||
| 8 | APBA1 | 1437940_at 1455369_at 1459605_at | 11783 | -0.013 | -0.3860 | No | ||
| 9 | MAFF | 1418936_at | 15503 | -0.103 | -0.5425 | No | ||
| 10 | VIP | 1428664_at | 16842 | -0.150 | -0.5845 | No | ||
| 11 | ICAM1 | 1424067_at | 19292 | -0.345 | -0.6521 | Yes | ||
| 12 | UBR1 | 1420971_at 1440552_at 1446438_at 1450066_at 1457796_at 1458033_at | 19544 | -0.382 | -0.6148 | Yes | ||
| 13 | ELMO1 | 1424523_at 1446610_at 1450208_a_at | 19716 | -0.409 | -0.5704 | Yes | ||
| 14 | IRF1 | 1448436_a_at | 20336 | -0.561 | -0.5270 | Yes | ||
| 15 | HNRPR | 1427129_a_at 1438807_at 1452030_a_at | 21352 | -1.282 | -0.4095 | Yes | ||
| 16 | ASXL1 | 1434561_at 1435077_at 1458380_at | 21529 | -1.599 | -0.2132 | Yes | ||
| 17 | TRAF4 | 1416571_at 1460642_at | 21617 | -1.814 | 0.0146 | Yes |