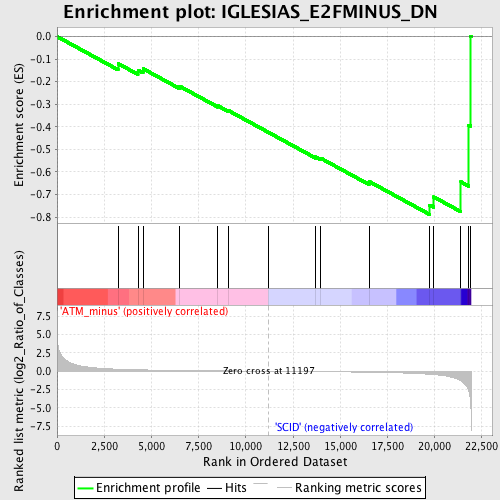
Profile of the Running ES Score & Positions of GeneSet Members on the Rank Ordered List
| Dataset | Set_01_ATM_minus_versus_SCID.phenotype_ATM_minus_versus_SCID.cls #ATM_minus_versus_SCID |
| Phenotype | phenotype_ATM_minus_versus_SCID.cls#ATM_minus_versus_SCID |
| Upregulated in class | SCID |
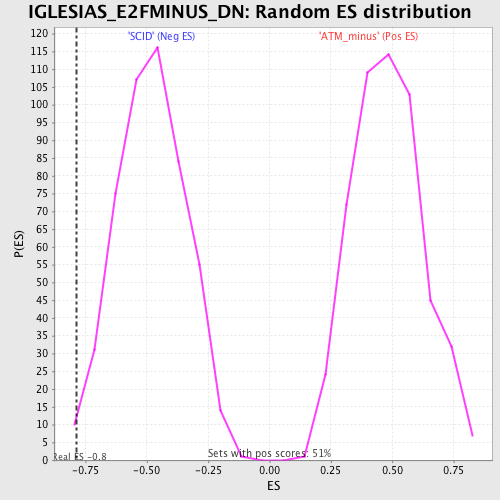
| GeneSet | IGLESIAS_E2FMINUS_DN |
| Enrichment Score (ES) | -0.7884292 |
| Normalized Enrichment Score (NES) | -1.6370677 |
| Nominal p-value | 0.010141988 |
| FDR q-value | 0.6574782 |
| FWER p-Value | 0.999 |
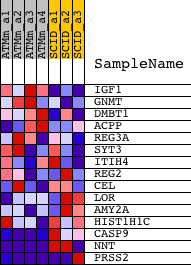
| PROBE | DESCRIPTION (from dataset) | GENE SYMBOL | GENE_TITLE | RANK IN GENE LIST | RANK METRIC SCORE | RUNNING ES | CORE ENRICHMENT | |
|---|---|---|---|---|---|---|---|---|
| 1 | IGF1 | 1419519_at 1436497_at 1437401_at 1452014_a_at | 3229 | 0.274 | -0.1197 | No | ||
| 2 | GNMT | 1417422_at | 4285 | 0.193 | -0.1483 | No | ||
| 3 | DMBT1 | 1418287_a_at | 4552 | 0.179 | -0.1424 | No | ||
| 4 | ACPP | 1416297_s_at 1419832_s_at 1441975_at 1448290_at 1453943_a_at | 6494 | 0.106 | -0.2202 | No | ||
| 5 | REG3A | 1449495_at | 8515 | 0.055 | -0.3068 | No | ||
| 6 | SYT3 | 1417708_at | 9090 | 0.042 | -0.3287 | No | ||
| 7 | ITIH4 | 1431808_a_at | 11219 | -0.000 | -0.4257 | No | ||
| 8 | REG2 | 1416139_at | 13699 | -0.055 | -0.5333 | No | ||
| 9 | CEL | 1417257_at | 13962 | -0.061 | -0.5391 | No | ||
| 10 | LOR | 1420183_at 1448745_s_at | 16524 | -0.137 | -0.6421 | No | ||
| 11 | AMY2A | 1457367_at | 19733 | -0.411 | -0.7470 | Yes | ||
| 12 | HIST1H1C | 1416101_a_at 1436994_a_at 1438204_at | 19949 | -0.456 | -0.7107 | Yes | ||
| 13 | CASP9 | 1426125_a_at 1437537_at 1457816_at | 21386 | -1.311 | -0.6439 | Yes | ||
| 14 | NNT | 1416105_at 1432608_at 1456573_x_at | 21803 | -2.678 | -0.3927 | Yes | ||
| 15 | PRSS2 | 1417682_a_at 1433459_x_at 1433573_x_at 1435507_x_at | 21891 | -3.952 | 0.0021 | Yes |