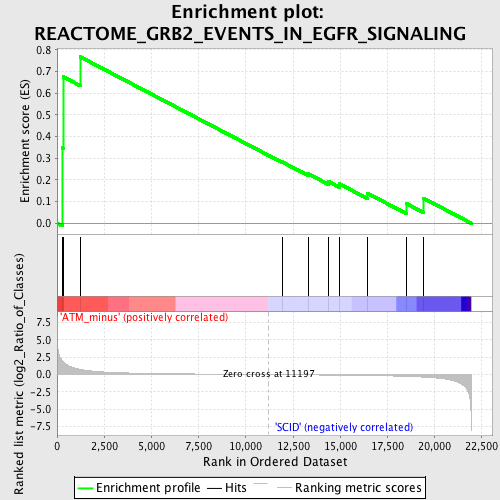
Profile of the Running ES Score & Positions of GeneSet Members on the Rank Ordered List
| Dataset | Set_01_ATM_minus_versus_SCID.phenotype_ATM_minus_versus_SCID.cls #ATM_minus_versus_SCID |
| Phenotype | phenotype_ATM_minus_versus_SCID.cls#ATM_minus_versus_SCID |
| Upregulated in class | ATM_minus |
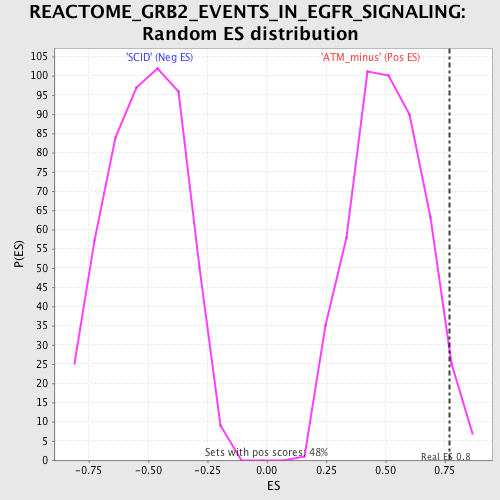
| GeneSet | REACTOME_GRB2_EVENTS_IN_EGFR_SIGNALING |
| Enrichment Score (ES) | 0.7679267 |
| Normalized Enrichment Score (NES) | 1.5028478 |
| Nominal p-value | 0.035416666 |
| FDR q-value | 0.8530393 |
| FWER p-Value | 1.0 |
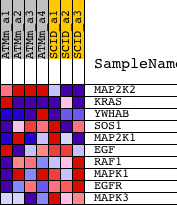
| PROBE | DESCRIPTION (from dataset) | GENE SYMBOL | GENE_TITLE | RANK IN GENE LIST | RANK METRIC SCORE | RUNNING ES | CORE ENRICHMENT | |
|---|---|---|---|---|---|---|---|---|
| 1 | MAP2K2 | 1415974_at 1443436_at 1460636_at | 274 | 1.989 | 0.3487 | Yes | ||
| 2 | KRAS | 1426228_at 1426229_s_at 1434000_at 1451979_at | 319 | 1.813 | 0.6759 | Yes | ||
| 3 | YWHAB | 1420878_a_at 1420879_a_at 1420880_a_at 1436783_x_at 1438708_x_at 1455815_a_at | 1221 | 0.733 | 0.7679 | Yes | ||
| 4 | SOS1 | 1421884_at 1421885_at 1421886_at | 11915 | -0.015 | 0.2830 | No | ||
| 5 | MAP2K1 | 1416351_at | 13294 | -0.045 | 0.2284 | No | ||
| 6 | EGF | 1418093_a_at | 14364 | -0.072 | 0.1927 | No | ||
| 7 | RAF1 | 1416078_s_at 1425419_a_at | 14937 | -0.087 | 0.1824 | No | ||
| 8 | MAPK1 | 1419568_at 1426585_s_at 1442876_at 1453104_at | 16428 | -0.133 | 0.1387 | No | ||
| 9 | EGFR | 1424932_at 1432647_at 1435888_at 1451530_at 1454313_at 1457563_at 1460420_a_at | 18510 | -0.256 | 0.0903 | No | ||
| 10 | MAPK3 | 1427060_at | 19421 | -0.363 | 0.1147 | No |