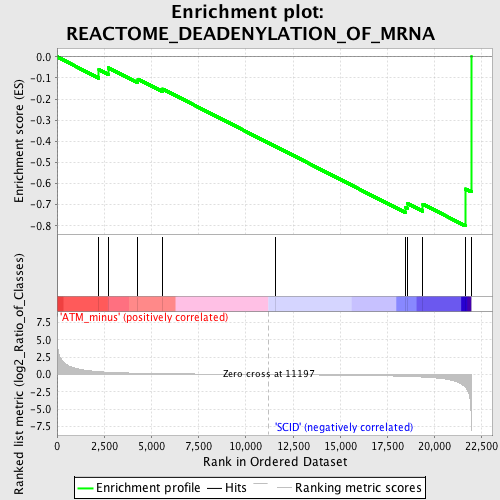
Profile of the Running ES Score & Positions of GeneSet Members on the Rank Ordered List
| Dataset | Set_01_ATM_minus_versus_SCID.phenotype_ATM_minus_versus_SCID.cls #ATM_minus_versus_SCID |
| Phenotype | phenotype_ATM_minus_versus_SCID.cls#ATM_minus_versus_SCID |
| Upregulated in class | SCID |
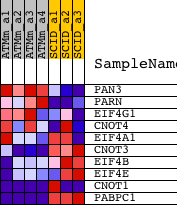
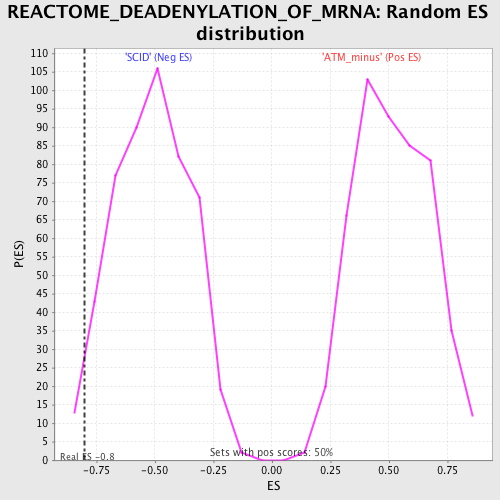
| GeneSet | REACTOME_DEADENYLATION_OF_MRNA |
| Enrichment Score (ES) | -0.8006681 |
| Normalized Enrichment Score (NES) | -1.5612208 |
| Nominal p-value | 0.02584493 |
| FDR q-value | 0.9188979 |
| FWER p-Value | 1.0 |
| PROBE | DESCRIPTION (from dataset) | GENE SYMBOL | GENE_TITLE | RANK IN GENE LIST | RANK METRIC SCORE | RUNNING ES | CORE ENRICHMENT | |
|---|---|---|---|---|---|---|---|---|
| 1 | PAN3 | 1428768_at 1440149_at 1447895_x_at 1458465_at | 2214 | 0.421 | -0.0612 | No | ||
| 2 | PARN | 1425422_a_at 1437334_x_at | 2715 | 0.335 | -0.0522 | No | ||
| 3 | EIF4G1 | 1427036_a_at 1427037_at 1438686_at | 4282 | 0.193 | -0.1054 | No | ||
| 4 | CNOT4 | 1420999_at 1421000_at 1436645_a_at 1437586_at 1443169_at 1450083_at 1459449_at | 5588 | 0.135 | -0.1521 | No | ||
| 5 | EIF4A1 | 1427058_at 1430980_a_at 1434985_a_at | 11569 | -0.008 | -0.4241 | No | ||
| 6 | CNOT3 | 1435965_at 1441465_at | 18469 | -0.252 | -0.7149 | Yes | ||
| 7 | EIF4B | 1426378_at 1426379_at 1426380_at | 18572 | -0.262 | -0.6947 | Yes | ||
| 8 | EIF4E | 1450909_at 1457489_at 1459371_at | 19374 | -0.356 | -0.6976 | Yes | ||
| 9 | CNOT1 | 1434251_at 1457546_at | 21634 | -1.852 | -0.6255 | Yes | ||
| 10 | PABPC1 | 1418883_a_at 1419500_at 1453840_at | 21934 | -6.759 | 0.0001 | Yes |