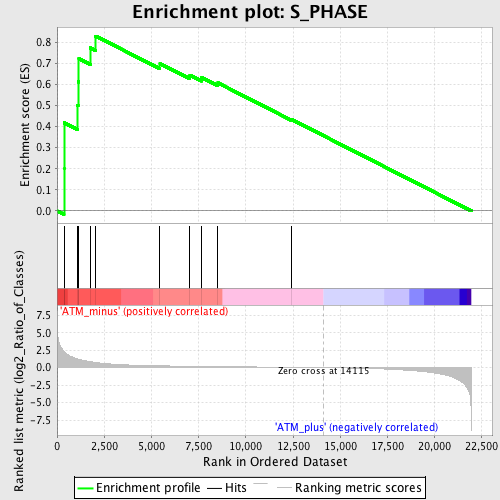
Profile of the Running ES Score & Positions of GeneSet Members on the Rank Ordered List
| Dataset | Set_01_ATM_minus_versus_ATM_plus.phenotype_ATM_minus_versus_ATM_plus.cls #ATM_minus_versus_ATM_plus.phenotype_ATM_minus_versus_ATM_plus.cls #ATM_minus_versus_ATM_plus_repos |
| Phenotype | phenotype_ATM_minus_versus_ATM_plus.cls#ATM_minus_versus_ATM_plus_repos |
| Upregulated in class | ATM_minus |
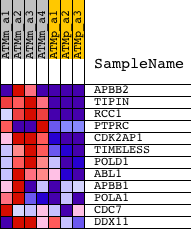
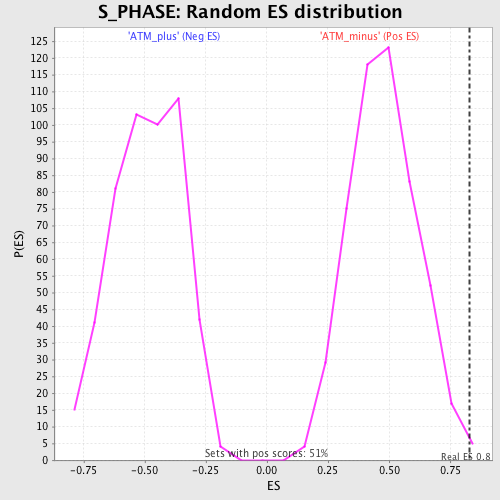
| GeneSet | S_PHASE |
| Enrichment Score (ES) | 0.82917273 |
| Normalized Enrichment Score (NES) | 1.7410913 |
| Nominal p-value | 0.0059288535 |
| FDR q-value | 0.16250063 |
| FWER p-Value | 0.583 |
| PROBE | DESCRIPTION (from dataset) | GENE SYMBOL | GENE_TITLE | RANK IN GENE LIST | RANK METRIC SCORE | RUNNING ES | CORE ENRICHMENT | |
|---|---|---|---|---|---|---|---|---|
| 1 | APBB2 | 1426719_at 1426720_at 1440135_at 1446481_at 1452342_at | 365 | 2.326 | 0.2018 | Yes | ||
| 2 | TIPIN | 1426612_at | 370 | 2.311 | 0.4187 | Yes | ||
| 3 | RCC1 | 1416962_at | 1081 | 1.229 | 0.5016 | Yes | ||
| 4 | PTPRC | 1422124_a_at 1440165_at | 1114 | 1.204 | 0.6132 | Yes | ||
| 5 | CDK2AP1 | 1426885_a_at 1435509_x_at 1456314_x_at | 1156 | 1.175 | 0.7217 | Yes | ||
| 6 | TIMELESS | 1417586_at 1417587_at | 1763 | 0.847 | 0.7736 | Yes | ||
| 7 | POLD1 | 1448187_at 1456055_x_at | 2046 | 0.729 | 0.8292 | Yes | ||
| 8 | ABL1 | 1423999_at 1441291_at 1444134_at 1445153_at | 5448 | 0.261 | 0.6986 | No | ||
| 9 | APBB1 | 1423892_at 1423893_x_at | 7033 | 0.195 | 0.6447 | No | ||
| 10 | POLA1 | 1419397_at 1456285_at 1459319_at 1459963_at | 7660 | 0.174 | 0.6325 | No | ||
| 11 | CDC7 | 1426002_a_at 1426021_a_at | 8519 | 0.149 | 0.6073 | No | ||
| 12 | DDX11 | 1438447_at 1441062_at | 12396 | 0.049 | 0.4351 | No |