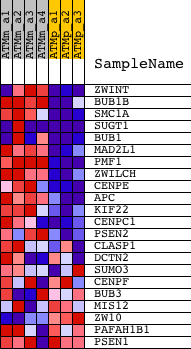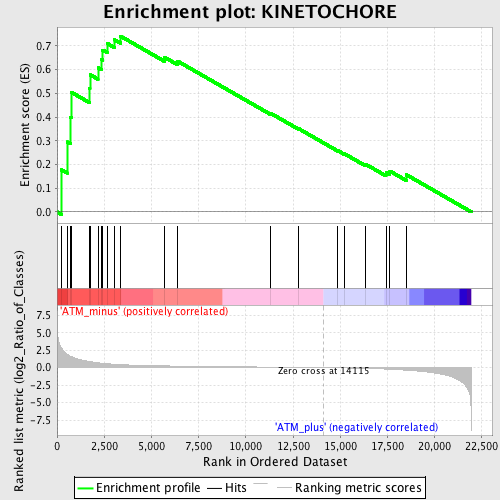
Profile of the Running ES Score & Positions of GeneSet Members on the Rank Ordered List
| Dataset | Set_01_ATM_minus_versus_ATM_plus.phenotype_ATM_minus_versus_ATM_plus.cls #ATM_minus_versus_ATM_plus.phenotype_ATM_minus_versus_ATM_plus.cls #ATM_minus_versus_ATM_plus_repos |
| Phenotype | phenotype_ATM_minus_versus_ATM_plus.cls#ATM_minus_versus_ATM_plus_repos |
| Upregulated in class | ATM_minus |
| GeneSet | KINETOCHORE |
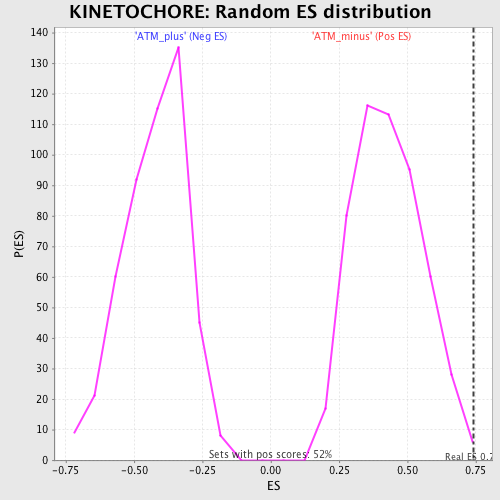
| Enrichment Score (ES) | 0.74130845 |
| Normalized Enrichment Score (NES) | 1.7247517 |
| Nominal p-value | 0.0038834952 |
| FDR q-value | 0.14330584 |
| FWER p-Value | 0.672 |
| PROBE | DESCRIPTION (from dataset) | GENE SYMBOL | GENE_TITLE | RANK IN GENE LIST | RANK METRIC SCORE | RUNNING ES | CORE ENRICHMENT | |
|---|---|---|---|---|---|---|---|---|
| 1 | ZWINT | 1423724_at 1427539_a_at 1427540_at 1429786_a_at 1429787_x_at 1444717_at 1455382_at | 236 | 2.731 | 0.1773 | Yes | ||
| 2 | BUB1B | 1416961_at 1447362_at 1447363_s_at | 531 | 1.905 | 0.2951 | Yes | ||
| 3 | SMC1A | 1417830_at 1417831_at 1417832_at | 718 | 1.620 | 0.3982 | Yes | ||
| 4 | SUGT1 | 1426424_at 1426425_at 1446757_at | 765 | 1.568 | 0.5041 | Yes | ||
| 5 | BUB1 | 1424046_at 1438571_at | 1704 | 0.876 | 0.5216 | Yes | ||
| 6 | MAD2L1 | 1422460_at | 1742 | 0.858 | 0.5789 | Yes | ||
| 7 | PMF1 | 1416707_a_at 1438173_x_at | 2167 | 0.693 | 0.6073 | Yes | ||
| 8 | ZWILCH | 1416757_at | 2355 | 0.635 | 0.6426 | Yes | ||
| 9 | CENPE | 1435005_at 1439040_at | 2414 | 0.620 | 0.6826 | Yes | ||
| 10 | APC | 1420956_at 1420957_at 1435543_at 1450056_at | 2651 | 0.562 | 0.7106 | Yes | ||
| 11 | KIF22 | 1423813_at 1437716_x_at 1451128_s_at | 3036 | 0.481 | 0.7262 | Yes | ||
| 12 | CENPC1 | 1420441_at | 3355 | 0.430 | 0.7413 | Yes | ||
| 13 | PSEN2 | 1425869_a_at 1431542_at | 5675 | 0.250 | 0.6527 | No | ||
| 14 | CLASP1 | 1427353_at 1452265_at 1459233_at 1460102_at | 6368 | 0.221 | 0.6363 | No | ||
| 15 | DCTN2 | 1424461_at | 11312 | 0.075 | 0.4160 | No | ||
| 16 | SUMO3 | 1422457_s_at 1439372_at | 12781 | 0.039 | 0.3517 | No | ||
| 17 | CENPF | 1427161_at 1452334_at 1458447_at | 14868 | -0.028 | 0.2584 | No | ||
| 18 | BUB3 | 1416815_s_at 1448058_s_at 1448473_at 1459104_at 1459918_at | 15208 | -0.041 | 0.2458 | No | ||
| 19 | MIS12 | 1424717_at | 16344 | -0.102 | 0.2010 | No | ||
| 20 | ZW10 | 1424891_a_at 1431747_at 1445206_at | 17420 | -0.200 | 0.1657 | No | ||
| 21 | PAFAH1B1 | 1417086_at 1427703_at 1439656_at 1441404_at 1444125_at 1448578_at 1456947_at 1460199_a_at | 17624 | -0.229 | 0.1722 | No | ||
| 22 | PSEN1 | 1420261_at 1421853_at 1425549_at 1450399_at | 18490 | -0.355 | 0.1572 | No |