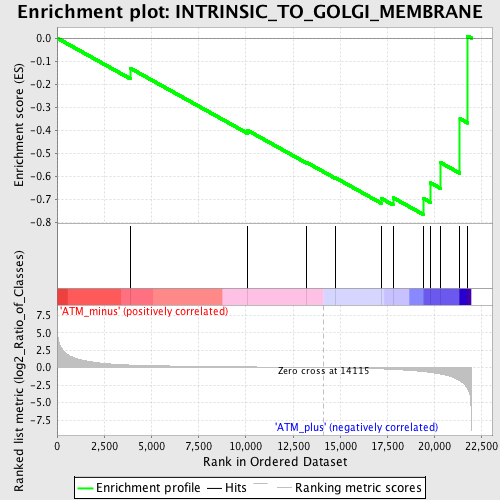
Profile of the Running ES Score & Positions of GeneSet Members on the Rank Ordered List
| Dataset | Set_01_ATM_minus_versus_ATM_plus.phenotype_ATM_minus_versus_ATM_plus.cls #ATM_minus_versus_ATM_plus.phenotype_ATM_minus_versus_ATM_plus.cls #ATM_minus_versus_ATM_plus_repos |
| Phenotype | phenotype_ATM_minus_versus_ATM_plus.cls#ATM_minus_versus_ATM_plus_repos |
| Upregulated in class | ATM_plus |
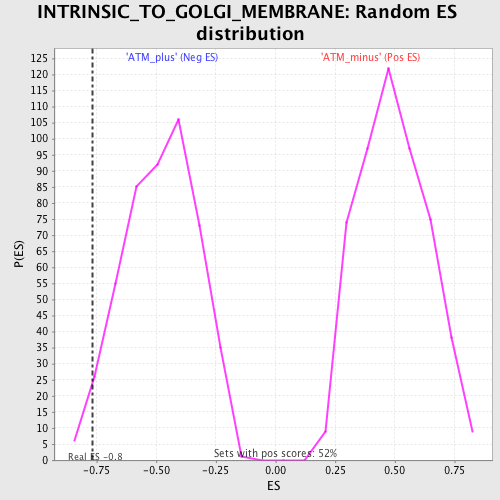
| GeneSet | INTRINSIC_TO_GOLGI_MEMBRANE |
| Enrichment Score (ES) | -0.76629776 |
| Normalized Enrichment Score (NES) | -1.5902947 |
| Nominal p-value | 0.025052192 |
| FDR q-value | 0.5946115 |
| FWER p-Value | 0.999 |
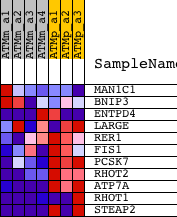
| PROBE | DESCRIPTION (from dataset) | GENE SYMBOL | GENE_TITLE | RANK IN GENE LIST | RANK METRIC SCORE | RUNNING ES | CORE ENRICHMENT | |
|---|---|---|---|---|---|---|---|---|
| 1 | MAN1C1 | 1436193_at | 3877 | 0.367 | -0.1309 | No | ||
| 2 | BNIP3 | 1422470_at | 10097 | 0.106 | -0.4013 | No | ||
| 3 | ENTPD4 | 1431761_at 1438177_x_at 1447900_x_at 1449190_a_at | 13226 | 0.026 | -0.5406 | No | ||
| 4 | LARGE | 1417435_at 1417436_at 1441642_at 1442420_at 1443212_at 1458663_at | 14737 | -0.023 | -0.6067 | No | ||
| 5 | RER1 | 1460660_x_at 1460706_s_at | 17163 | -0.170 | -0.6960 | No | ||
| 6 | FIS1 | 1416764_at 1443819_x_at | 17796 | -0.251 | -0.6934 | No | ||
| 7 | PCSK7 | 1417180_at | 19395 | -0.559 | -0.6963 | Yes | ||
| 8 | RHOT2 | 1426822_at | 19776 | -0.677 | -0.6289 | Yes | ||
| 9 | ATP7A | 1418774_a_at 1436921_at | 20310 | -0.898 | -0.5408 | Yes | ||
| 10 | RHOT1 | 1423533_a_at 1440853_at | 21337 | -1.894 | -0.3503 | Yes | ||
| 11 | STEAP2 | 1428636_at 1438773_at 1442359_at 1444290_at 1446071_at | 21749 | -3.015 | 0.0085 | Yes |