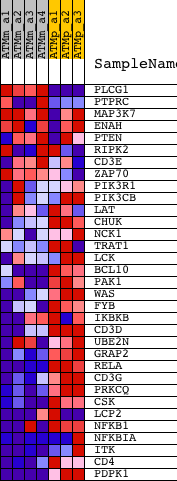
Profile of the Running ES Score & Positions of GeneSet Members on the Rank Ordered List
| Dataset | Set_01_ATM_minus_versus_ATM_plus.phenotype_ATM_minus_versus_ATM_plus.cls #ATM_minus_versus_ATM_plus.phenotype_ATM_minus_versus_ATM_plus.cls #ATM_minus_versus_ATM_plus_repos |
| Phenotype | phenotype_ATM_minus_versus_ATM_plus.cls#ATM_minus_versus_ATM_plus_repos |
| Upregulated in class | ATM_plus |
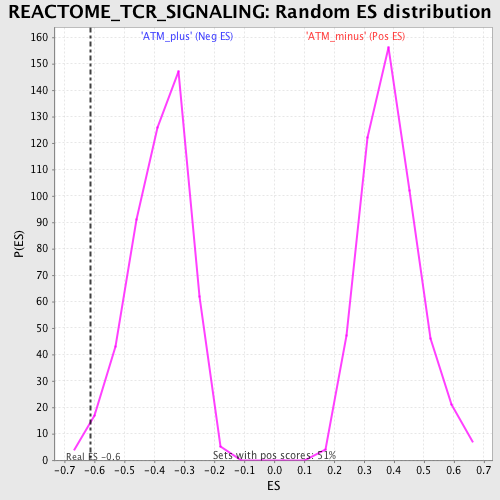
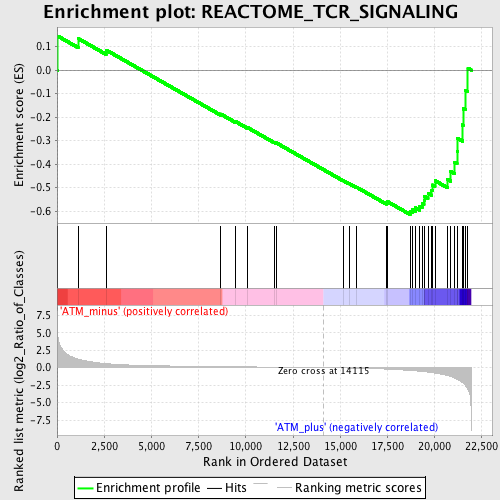
| GeneSet | REACTOME_TCR_SIGNALING |
| Enrichment Score (ES) | -0.61389077 |
| Normalized Enrichment Score (NES) | -1.6051563 |
| Nominal p-value | 0.016161617 |
| FDR q-value | 0.24134877 |
| FWER p-Value | 0.993 |
| PROBE | DESCRIPTION (from dataset) | GENE SYMBOL | GENE_TITLE | RANK IN GENE LIST | RANK METRIC SCORE | RUNNING ES | CORE ENRICHMENT | |
|---|---|---|---|---|---|---|---|---|
| 1 | PLCG1 | 1435149_at 1450360_at | 37 | 4.528 | 0.1448 | No | ||
| 2 | PTPRC | 1422124_a_at 1440165_at | 1114 | 1.204 | 0.1346 | No | ||
| 3 | MAP3K7 | 1419988_at 1425795_a_at 1426627_at 1449693_at 1455441_at 1458787_at | 2595 | 0.574 | 0.0856 | No | ||
| 4 | ENAH | 1421624_a_at 1424800_at 1424801_at 1431162_a_at 1442223_at 1446426_at 1458876_at | 8658 | 0.145 | -0.1865 | No | ||
| 5 | PTEN | 1422553_at 1441593_at 1444325_at 1450655_at 1454722_at 1455728_at 1457493_at | 9442 | 0.123 | -0.2182 | No | ||
| 6 | RIPK2 | 1421236_at 1450173_at | 10083 | 0.106 | -0.2440 | No | ||
| 7 | CD3E | 1422105_at 1445748_at | 11496 | 0.071 | -0.3062 | No | ||
| 8 | ZAP70 | 1422701_at 1439749_at 1440178_x_at | 11615 | 0.067 | -0.3094 | No | ||
| 9 | PIK3R1 | 1425514_at 1425515_at 1438682_at 1444591_at 1451737_at | 15150 | -0.039 | -0.4695 | No | ||
| 10 | PIK3CB | 1445731_at 1453069_at | 15462 | -0.052 | -0.4820 | No | ||
| 11 | LAT | 1460651_at | 15852 | -0.072 | -0.4974 | No | ||
| 12 | CHUK | 1417091_at 1428210_s_at 1451383_a_at | 17435 | -0.202 | -0.5631 | No | ||
| 13 | NCK1 | 1421487_a_at 1424543_at 1447271_at | 17487 | -0.209 | -0.5587 | No | ||
| 14 | TRAT1 | 1427532_at 1437561_at | 18697 | -0.395 | -0.6011 | Yes | ||
| 15 | LCK | 1425396_a_at 1439145_at 1439146_s_at 1457917_at | 18818 | -0.421 | -0.5929 | Yes | ||
| 16 | BCL10 | 1418970_a_at 1418971_x_at 1418972_at 1443524_x_at | 18974 | -0.459 | -0.5852 | Yes | ||
| 17 | PAK1 | 1420979_at 1420980_at 1450070_s_at 1459029_at | 19199 | -0.510 | -0.5789 | Yes | ||
| 18 | WAS | 1419631_at | 19333 | -0.543 | -0.5674 | Yes | ||
| 19 | FYB | 1452117_a_at | 19433 | -0.570 | -0.5535 | Yes | ||
| 20 | IKBKB | 1426207_at 1426333_a_at 1432275_at 1445141_at 1454184_a_at | 19447 | -0.577 | -0.5354 | Yes | ||
| 21 | CD3D | 1422828_at | 19644 | -0.636 | -0.5238 | Yes | ||
| 22 | UBE2N | 1422559_at 1435384_at | 19842 | -0.704 | -0.5100 | Yes | ||
| 23 | GRAP2 | 1456432_at | 19875 | -0.712 | -0.4884 | Yes | ||
| 24 | RELA | 1419536_a_at | 20015 | -0.767 | -0.4699 | Yes | ||
| 25 | CD3G | 1419178_at | 20668 | -1.109 | -0.4638 | Yes | ||
| 26 | PRKCQ | 1426044_a_at | 20851 | -1.253 | -0.4316 | Yes | ||
| 27 | CSK | 1423518_at 1439744_at | 21063 | -1.495 | -0.3929 | Yes | ||
| 28 | LCP2 | 1418641_at 1418642_at | 21182 | -1.674 | -0.3441 | Yes | ||
| 29 | NFKB1 | 1427705_a_at 1442949_at | 21207 | -1.718 | -0.2896 | Yes | ||
| 30 | NFKBIA | 1420088_at 1420089_at 1438157_s_at 1448306_at 1449731_s_at | 21477 | -2.135 | -0.2328 | Yes | ||
| 31 | ITK | 1417171_at 1430833_at 1452518_a_at 1456836_at 1457120_at | 21504 | -2.182 | -0.1634 | Yes | ||
| 32 | CD4 | 1419696_at 1427779_a_at | 21629 | -2.582 | -0.0856 | Yes | ||
| 33 | PDPK1 | 1415729_at 1416501_at 1459775_at 1459776_x_at | 21761 | -3.077 | 0.0080 | Yes |