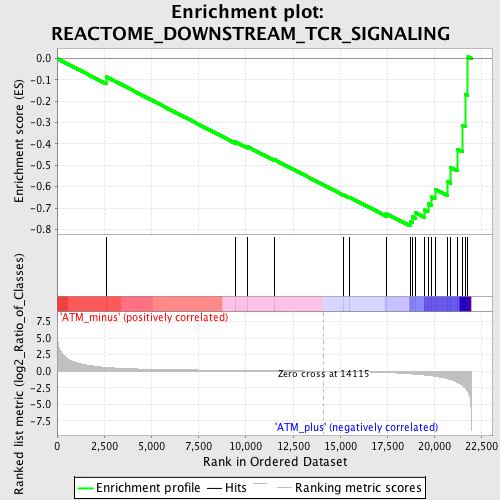
Profile of the Running ES Score & Positions of GeneSet Members on the Rank Ordered List
| Dataset | Set_01_ATM_minus_versus_ATM_plus.phenotype_ATM_minus_versus_ATM_plus.cls #ATM_minus_versus_ATM_plus.phenotype_ATM_minus_versus_ATM_plus.cls #ATM_minus_versus_ATM_plus_repos |
| Phenotype | phenotype_ATM_minus_versus_ATM_plus.cls#ATM_minus_versus_ATM_plus_repos |
| Upregulated in class | ATM_plus |
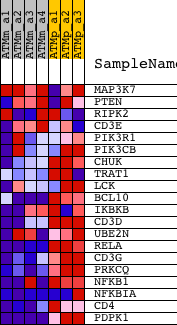
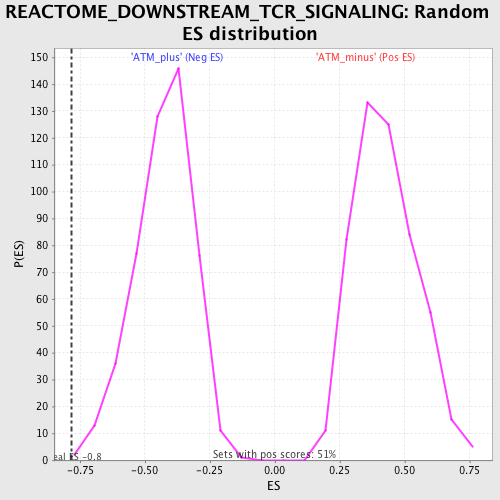
| GeneSet | REACTOME_DOWNSTREAM_TCR_SIGNALING |
| Enrichment Score (ES) | -0.78413135 |
| Normalized Enrichment Score (NES) | -1.8341732 |
| Nominal p-value | 0.0020408162 |
| FDR q-value | 0.1134936 |
| FWER p-Value | 0.113 |
| PROBE | DESCRIPTION (from dataset) | GENE SYMBOL | GENE_TITLE | RANK IN GENE LIST | RANK METRIC SCORE | RUNNING ES | CORE ENRICHMENT | |
|---|---|---|---|---|---|---|---|---|
| 1 | MAP3K7 | 1419988_at 1425795_a_at 1426627_at 1449693_at 1455441_at 1458787_at | 2595 | 0.574 | -0.0847 | No | ||
| 2 | PTEN | 1422553_at 1441593_at 1444325_at 1450655_at 1454722_at 1455728_at 1457493_at | 9442 | 0.123 | -0.3898 | No | ||
| 3 | RIPK2 | 1421236_at 1450173_at | 10083 | 0.106 | -0.4127 | No | ||
| 4 | CD3E | 1422105_at 1445748_at | 11496 | 0.071 | -0.4730 | No | ||
| 5 | PIK3R1 | 1425514_at 1425515_at 1438682_at 1444591_at 1451737_at | 15150 | -0.039 | -0.6374 | No | ||
| 6 | PIK3CB | 1445731_at 1453069_at | 15462 | -0.052 | -0.6485 | No | ||
| 7 | CHUK | 1417091_at 1428210_s_at 1451383_a_at | 17435 | -0.202 | -0.7266 | No | ||
| 8 | TRAT1 | 1427532_at 1437561_at | 18697 | -0.395 | -0.7609 | Yes | ||
| 9 | LCK | 1425396_a_at 1439145_at 1439146_s_at 1457917_at | 18818 | -0.421 | -0.7416 | Yes | ||
| 10 | BCL10 | 1418970_a_at 1418971_x_at 1418972_at 1443524_x_at | 18974 | -0.459 | -0.7216 | Yes | ||
| 11 | IKBKB | 1426207_at 1426333_a_at 1432275_at 1445141_at 1454184_a_at | 19447 | -0.577 | -0.7092 | Yes | ||
| 12 | CD3D | 1422828_at | 19644 | -0.636 | -0.6807 | Yes | ||
| 13 | UBE2N | 1422559_at 1435384_at | 19842 | -0.704 | -0.6483 | Yes | ||
| 14 | RELA | 1419536_a_at | 20015 | -0.767 | -0.6110 | Yes | ||
| 15 | CD3G | 1419178_at | 20668 | -1.109 | -0.5756 | Yes | ||
| 16 | PRKCQ | 1426044_a_at | 20851 | -1.253 | -0.5102 | Yes | ||
| 17 | NFKB1 | 1427705_a_at 1442949_at | 21207 | -1.718 | -0.4253 | Yes | ||
| 18 | NFKBIA | 1420088_at 1420089_at 1438157_s_at 1448306_at 1449731_s_at | 21477 | -2.135 | -0.3120 | Yes | ||
| 19 | CD4 | 1419696_at 1427779_a_at | 21629 | -2.582 | -0.1670 | Yes | ||
| 20 | PDPK1 | 1415729_at 1416501_at 1459775_at 1459776_x_at | 21761 | -3.077 | 0.0080 | Yes |