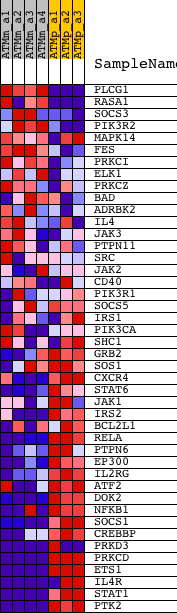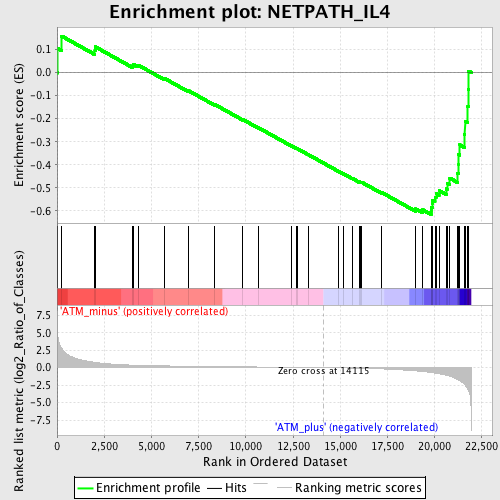
Profile of the Running ES Score & Positions of GeneSet Members on the Rank Ordered List
| Dataset | Set_01_ATM_minus_versus_ATM_plus.phenotype_ATM_minus_versus_ATM_plus.cls #ATM_minus_versus_ATM_plus.phenotype_ATM_minus_versus_ATM_plus.cls #ATM_minus_versus_ATM_plus_repos |
| Phenotype | phenotype_ATM_minus_versus_ATM_plus.cls#ATM_minus_versus_ATM_plus_repos |
| Upregulated in class | ATM_plus |
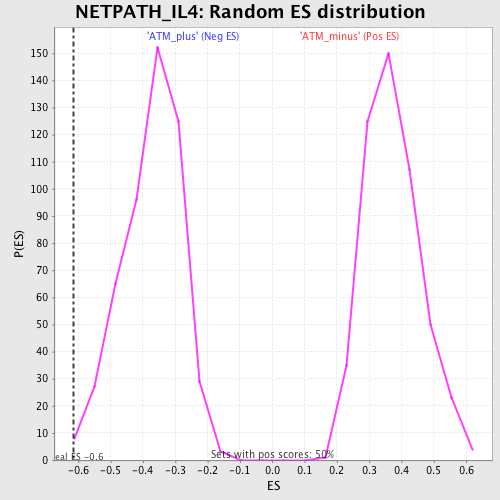
| GeneSet | NETPATH_IL4 |
| Enrichment Score (ES) | -0.6157896 |
| Normalized Enrichment Score (NES) | -1.6513063 |
| Nominal p-value | 0.003960396 |
| FDR q-value | 0.18633582 |
| FWER p-Value | 0.934 |
| PROBE | DESCRIPTION (from dataset) | GENE SYMBOL | GENE_TITLE | RANK IN GENE LIST | RANK METRIC SCORE | RUNNING ES | CORE ENRICHMENT | |
|---|---|---|---|---|---|---|---|---|
| 1 | PLCG1 | 1435149_at 1450360_at | 37 | 4.528 | 0.1045 | No | ||
| 2 | RASA1 | 1426476_at 1426477_at 1426478_at 1438998_at | 243 | 2.703 | 0.1585 | No | ||
| 3 | SOCS3 | 1416576_at 1455899_x_at 1456212_x_at | 2004 | 0.744 | 0.0955 | No | ||
| 4 | PIK3R2 | 1418463_at | 2025 | 0.739 | 0.1119 | No | ||
| 5 | MAPK14 | 1416703_at 1416704_at 1426104_at 1442364_at 1451927_a_at 1459617_at | 4014 | 0.353 | 0.0294 | No | ||
| 6 | FES | 1427368_x_at 1452410_a_at | 4035 | 0.351 | 0.0367 | No | ||
| 7 | PRKCI | 1417410_s_at 1448695_at | 4300 | 0.330 | 0.0324 | No | ||
| 8 | ELK1 | 1421896_at 1421897_at 1446390_at | 5676 | 0.250 | -0.0246 | No | ||
| 9 | PRKCZ | 1418085_at 1449692_at 1454902_at | 6944 | 0.199 | -0.0778 | No | ||
| 10 | BAD | 1416582_a_at 1416583_at | 8347 | 0.154 | -0.1382 | No | ||
| 11 | ADRBK2 | 1434450_s_at 1439178_at 1440801_s_at | 9836 | 0.112 | -0.2035 | No | ||
| 12 | IL4 | 1449864_at | 10673 | 0.092 | -0.2396 | No | ||
| 13 | JAK3 | 1425750_a_at 1446515_at | 12394 | 0.049 | -0.3170 | No | ||
| 14 | PTPN11 | 1421196_at 1427699_a_at 1451225_at | 12683 | 0.041 | -0.3292 | No | ||
| 15 | SRC | 1423240_at 1450918_s_at | 12710 | 0.041 | -0.3294 | No | ||
| 16 | JAK2 | 1421065_at 1421066_at | 13301 | 0.024 | -0.3558 | No | ||
| 17 | CD40 | 1439221_s_at 1449473_s_at 1460415_a_at | 14914 | -0.030 | -0.4287 | No | ||
| 18 | PIK3R1 | 1425514_at 1425515_at 1438682_at 1444591_at 1451737_at | 15150 | -0.039 | -0.4385 | No | ||
| 19 | SOCS5 | 1423349_at 1423350_at 1441640_at 1442890_at | 15633 | -0.061 | -0.4591 | No | ||
| 20 | IRS1 | 1423104_at | 16007 | -0.081 | -0.4743 | No | ||
| 21 | PIK3CA | 1423144_at 1429434_at 1429435_x_at 1440054_at 1453134_at 1460326_at | 16083 | -0.086 | -0.4757 | No | ||
| 22 | SHC1 | 1422853_at 1422854_at | 16122 | -0.088 | -0.4753 | No | ||
| 23 | GRB2 | 1418508_a_at 1449111_a_at | 17171 | -0.170 | -0.5192 | No | ||
| 24 | SOS1 | 1421884_at 1421885_at 1421886_at | 18996 | -0.463 | -0.5917 | No | ||
| 25 | CXCR4 | 1448710_at | 19371 | -0.553 | -0.5958 | No | ||
| 26 | STAT6 | 1421708_a_at 1426353_at | 19810 | -0.691 | -0.5996 | Yes | ||
| 27 | JAK1 | 1433803_at 1433804_at 1433805_at | 19839 | -0.702 | -0.5844 | Yes | ||
| 28 | IRS2 | 1443969_at | 19886 | -0.716 | -0.5697 | Yes | ||
| 29 | BCL2L1 | 1420887_a_at 1420888_at 1426050_at 1426191_a_at | 19896 | -0.719 | -0.5533 | Yes | ||
| 30 | RELA | 1419536_a_at | 20015 | -0.767 | -0.5407 | Yes | ||
| 31 | PTPN6 | 1456694_x_at 1460188_at | 20072 | -0.789 | -0.5247 | Yes | ||
| 32 | EP300 | 1434765_at | 20230 | -0.858 | -0.5118 | Yes | ||
| 33 | IL2RG | 1416295_a_at 1416296_at | 20631 | -1.077 | -0.5048 | Yes | ||
| 34 | ATF2 | 1426582_at 1426583_at 1427559_a_at 1437777_at 1452116_s_at 1459237_at | 20657 | -1.100 | -0.4802 | Yes | ||
| 35 | DOK2 | 1416333_at | 20800 | -1.217 | -0.4581 | Yes | ||
| 36 | NFKB1 | 1427705_a_at 1442949_at | 21207 | -1.718 | -0.4364 | Yes | ||
| 37 | SOCS1 | 1440047_at 1450446_a_at | 21256 | -1.786 | -0.3967 | Yes | ||
| 38 | CREBBP | 1434633_at 1435224_at 1436983_at 1444856_at 1457641_at 1459804_at | 21262 | -1.794 | -0.3549 | Yes | ||
| 39 | PRKD3 | 1420567_at 1428229_at 1428230_at 1444691_at | 21330 | -1.887 | -0.3137 | Yes | ||
| 40 | PRKCD | 1422847_a_at 1442256_at | 21582 | -2.392 | -0.2691 | Yes | ||
| 41 | ETS1 | 1422027_a_at 1422028_a_at 1426725_s_at 1452163_at | 21603 | -2.483 | -0.2118 | Yes | ||
| 42 | IL4R | 1421034_a_at 1423996_a_at 1447858_x_at | 21753 | -3.032 | -0.1475 | Yes | ||
| 43 | STAT1 | 1420915_at 1440481_at 1450033_a_at 1450034_at | 21782 | -3.273 | -0.0721 | Yes | ||
| 44 | PTK2 | 1423059_at 1430827_a_at 1439198_at 1440082_at 1441475_at 1443384_at 1445137_at | 21796 | -3.373 | 0.0064 | Yes |