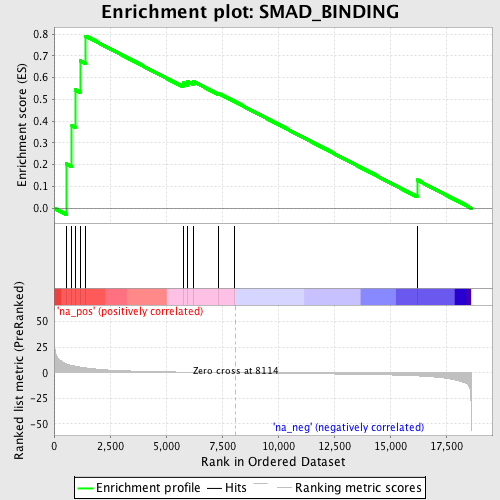
Profile of the Running ES Score & Positions of GeneSet Members on the Rank Ordered List
| Dataset | set04_transDMproB_versus_transDMpreB |
| Phenotype | NoPhenotypeAvailable |
| Upregulated in class | na_pos |
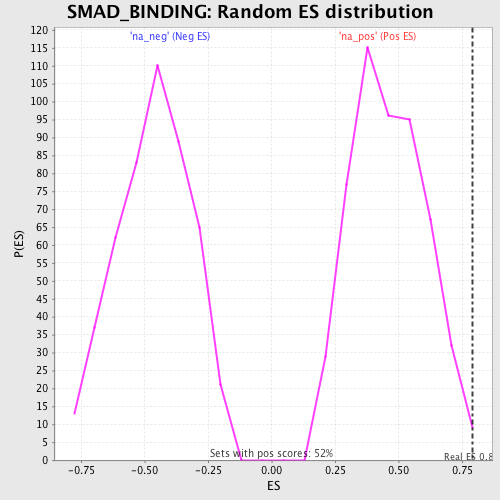
| GeneSet | SMAD_BINDING |
| Enrichment Score (ES) | 0.7903105 |
| Normalized Enrichment Score (NES) | 1.7172899 |
| Nominal p-value | 0.0038461538 |
| FDR q-value | 0.24541005 |
| FWER p-Value | 0.945 |
| PROBE | GENE SYMBOL | GENE_TITLE | RANK IN GENE LIST | RANK METRIC SCORE | RUNNING ES | CORE ENRICHMENT | |
|---|---|---|---|---|---|---|---|
| 1 | ACVR1 | 542 | 8.880 | 0.2038 | Yes | ||
| 2 | SMAD3 | 794 | 7.202 | 0.3792 | Yes | ||
| 3 | TGFBR1 | 938 | 6.577 | 0.5440 | Yes | ||
| 4 | SMAD4 | 1158 | 5.556 | 0.6780 | Yes | ||
| 5 | ACVR1B | 1414 | 4.804 | 0.7903 | Yes | ||
| 6 | BMPR1B | 5756 | 0.695 | 0.5752 | No | ||
| 7 | ACVRL1 | 5941 | 0.638 | 0.5821 | No | ||
| 8 | BMPR1A | 6205 | 0.561 | 0.5827 | No | ||
| 9 | FOXH1 | 7341 | 0.227 | 0.5276 | No | ||
| 10 | EID2 | 8073 | 0.011 | 0.4886 | No | ||
| 11 | STUB1 | 16203 | -2.973 | 0.1297 | No |