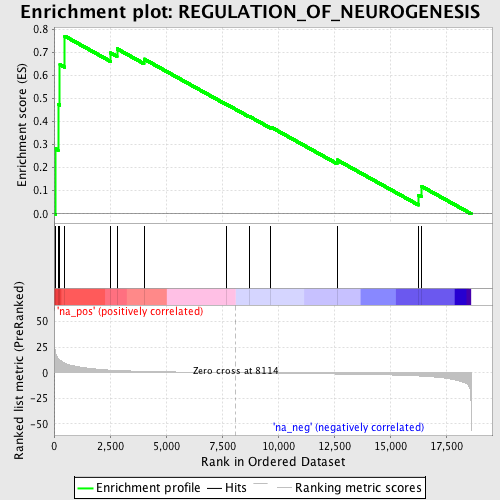
Profile of the Running ES Score & Positions of GeneSet Members on the Rank Ordered List
| Dataset | set04_transDMproB_versus_transDMpreB |
| Phenotype | NoPhenotypeAvailable |
| Upregulated in class | na_pos |
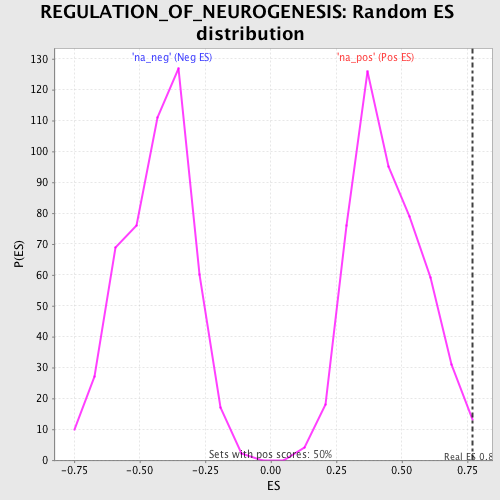
| GeneSet | REGULATION_OF_NEUROGENESIS |
| Enrichment Score (ES) | 0.7696502 |
| Normalized Enrichment Score (NES) | 1.7114189 |
| Nominal p-value | 0.011976048 |
| FDR q-value | 0.21450141 |
| FWER p-Value | 0.96 |
| PROBE | GENE SYMBOL | GENE_TITLE | RANK IN GENE LIST | RANK METRIC SCORE | RUNNING ES | CORE ENRICHMENT | |
|---|---|---|---|---|---|---|---|
| 1 | SERPINF1 | 55 | 20.063 | 0.2824 | Yes | ||
| 2 | KLK8 | 180 | 14.006 | 0.4750 | Yes | ||
| 3 | THY1 | 260 | 12.306 | 0.6458 | Yes | ||
| 4 | RTN4 | 478 | 9.526 | 0.7697 | Yes | ||
| 5 | AMIGO1 | 2529 | 2.628 | 0.6968 | No | ||
| 6 | MAPT | 2809 | 2.318 | 0.7148 | No | ||
| 7 | NF1 | 4013 | 1.433 | 0.6705 | No | ||
| 8 | ROBO1 | 7704 | 0.116 | 0.4739 | No | ||
| 9 | SLIT2 | 8712 | -0.158 | 0.4220 | No | ||
| 10 | APOE | 9677 | -0.391 | 0.3757 | No | ||
| 11 | YWHAH | 12632 | -1.149 | 0.2333 | No | ||
| 12 | NPTN | 16265 | -3.035 | 0.0812 | No | ||
| 13 | ROBO2 | 16405 | -3.169 | 0.1188 | No |