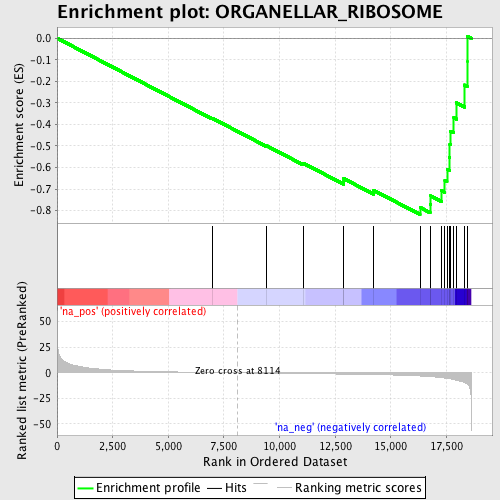
Profile of the Running ES Score & Positions of GeneSet Members on the Rank Ordered List
| Dataset | set04_transDMproB_versus_transDMpreB |
| Phenotype | NoPhenotypeAvailable |
| Upregulated in class | na_neg |
| GeneSet | ORGANELLAR_RIBOSOME |
| Enrichment Score (ES) | -0.81809574 |
| Normalized Enrichment Score (NES) | -2.1498058 |
| Nominal p-value | 0.0 |
| FDR q-value | 0.0 |
| FWER p-Value | 0.0 |
| PROBE | GENE SYMBOL | GENE_TITLE | RANK IN GENE LIST | RANK METRIC SCORE | RUNNING ES | CORE ENRICHMENT | |
|---|---|---|---|---|---|---|---|
| 1 | MRPS36 | 6964 | 0.334 | -0.3709 | No | ||
| 2 | MRPS16 | 9418 | -0.331 | -0.4993 | No | ||
| 3 | MRPS22 | 11060 | -0.730 | -0.5798 | No | ||
| 4 | MRPS21 | 12877 | -1.223 | -0.6645 | No | ||
| 5 | MRPS18C | 12885 | -1.226 | -0.6518 | No | ||
| 6 | MRPL51 | 14225 | -1.688 | -0.7059 | No | ||
| 7 | MRPL52 | 16313 | -3.080 | -0.7854 | Yes | ||
| 8 | MRPS11 | 16765 | -3.711 | -0.7702 | Yes | ||
| 9 | MRPL55 | 16796 | -3.760 | -0.7319 | Yes | ||
| 10 | MRPS28 | 17273 | -4.704 | -0.7075 | Yes | ||
| 11 | MRPS15 | 17432 | -5.110 | -0.6617 | Yes | ||
| 12 | MRPL23 | 17526 | -5.410 | -0.6092 | Yes | ||
| 13 | MRPL40 | 17631 | -5.748 | -0.5537 | Yes | ||
| 14 | MRPS18A | 17654 | -5.807 | -0.4932 | Yes | ||
| 15 | MRPS12 | 17691 | -5.951 | -0.4319 | Yes | ||
| 16 | MRPL10 | 17834 | -6.574 | -0.3696 | Yes | ||
| 17 | MRPS35 | 17954 | -7.161 | -0.3000 | Yes | ||
| 18 | MRPS24 | 18323 | -9.661 | -0.2171 | Yes | ||
| 19 | MRPL12 | 18432 | -10.904 | -0.1070 | Yes | ||
| 20 | MRPS10 | 18436 | -10.998 | 0.0097 | Yes |
