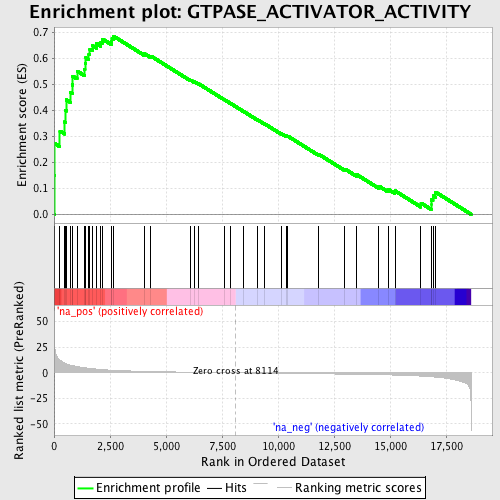
Profile of the Running ES Score & Positions of GeneSet Members on the Rank Ordered List
| Dataset | set04_transDMproB_versus_transDMpreB |
| Phenotype | NoPhenotypeAvailable |
| Upregulated in class | na_pos |
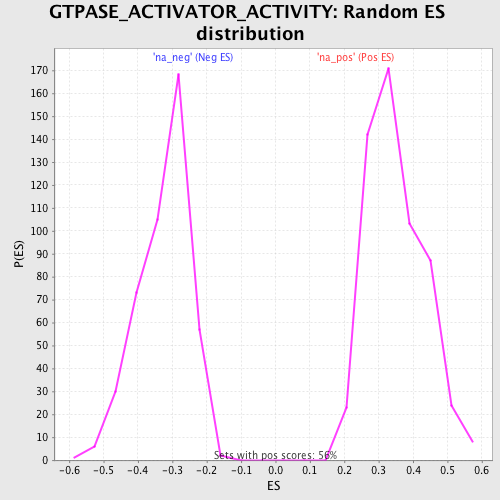
| GeneSet | GTPASE_ACTIVATOR_ACTIVITY |
| Enrichment Score (ES) | 0.68548703 |
| Normalized Enrichment Score (NES) | 1.9672029 |
| Nominal p-value | 0.0 |
| FDR q-value | 0.017770011 |
| FWER p-Value | 0.05 |
| PROBE | GENE SYMBOL | GENE_TITLE | RANK IN GENE LIST | RANK METRIC SCORE | RUNNING ES | CORE ENRICHMENT | |
|---|---|---|---|---|---|---|---|
| 1 | VAV3 | 12 | 30.494 | 0.1486 | Yes | ||
| 2 | ABR | 25 | 25.496 | 0.2727 | Yes | ||
| 3 | THY1 | 260 | 12.306 | 0.3203 | Yes | ||
| 4 | ARFGAP3 | 476 | 9.537 | 0.3554 | Yes | ||
| 5 | BCR | 501 | 9.330 | 0.3998 | Yes | ||
| 6 | RGS12 | 549 | 8.811 | 0.4403 | Yes | ||
| 7 | RASA4 | 720 | 7.607 | 0.4684 | Yes | ||
| 8 | SIPA1 | 813 | 7.080 | 0.4981 | Yes | ||
| 9 | RALBP1 | 832 | 7.008 | 0.5314 | Yes | ||
| 10 | RASA3 | 1025 | 6.143 | 0.5511 | Yes | ||
| 11 | RGS3 | 1364 | 4.932 | 0.5571 | Yes | ||
| 12 | CDC42EP2 | 1379 | 4.896 | 0.5803 | Yes | ||
| 13 | ARHGAP10 | 1417 | 4.798 | 0.6018 | Yes | ||
| 14 | RGS2 | 1552 | 4.449 | 0.6163 | Yes | ||
| 15 | RABGAP1 | 1596 | 4.330 | 0.6352 | Yes | ||
| 16 | RASA1 | 1707 | 4.056 | 0.6491 | Yes | ||
| 17 | OPHN1 | 1892 | 3.648 | 0.6570 | Yes | ||
| 18 | RGS1 | 2085 | 3.285 | 0.6628 | Yes | ||
| 19 | ARHGAP4 | 2163 | 3.163 | 0.6741 | Yes | ||
| 20 | MYO9B | 2569 | 2.584 | 0.6650 | Yes | ||
| 21 | RGS9 | 2583 | 2.568 | 0.6768 | Yes | ||
| 22 | CHN2 | 2649 | 2.487 | 0.6855 | Yes | ||
| 23 | NF1 | 4013 | 1.433 | 0.6191 | No | ||
| 24 | RGS6 | 4324 | 1.264 | 0.6086 | No | ||
| 25 | SOS1 | 6098 | 0.595 | 0.5160 | No | ||
| 26 | RACGAP1 | 6256 | 0.543 | 0.5102 | No | ||
| 27 | DOCK4 | 6432 | 0.492 | 0.5032 | No | ||
| 28 | ARFGEF1 | 7590 | 0.148 | 0.4416 | No | ||
| 29 | TSC2 | 7895 | 0.062 | 0.4256 | No | ||
| 30 | RGS11 | 8441 | -0.091 | 0.3967 | No | ||
| 31 | RASGRP3 | 9100 | -0.251 | 0.3625 | No | ||
| 32 | RGS20 | 9403 | -0.327 | 0.3478 | No | ||
| 33 | ALDH1A1 | 10135 | -0.511 | 0.3110 | No | ||
| 34 | ARHGAP5 | 10358 | -0.571 | 0.3018 | No | ||
| 35 | RASA2 | 10439 | -0.590 | 0.3004 | No | ||
| 36 | DEPDC2 | 11797 | -0.915 | 0.2318 | No | ||
| 37 | RGS4 | 12983 | -1.257 | 0.1741 | No | ||
| 38 | RGS16 | 13520 | -1.431 | 0.1523 | No | ||
| 39 | CENTD2 | 14496 | -1.810 | 0.1086 | No | ||
| 40 | DLC1 | 14919 | -2.008 | 0.0957 | No | ||
| 41 | RANGAP1 | 15217 | -2.168 | 0.0903 | No | ||
| 42 | RASAL1 | 16377 | -3.139 | 0.0433 | No | ||
| 43 | GMIP | 16837 | -3.820 | 0.0373 | No | ||
| 44 | RGS14 | 16840 | -3.824 | 0.0559 | No | ||
| 45 | BNIP2 | 16914 | -3.943 | 0.0712 | No | ||
| 46 | CENTA1 | 17027 | -4.161 | 0.0856 | No |