Profile of the Running ES Score & Positions of GeneSet Members on the Rank Ordered List
| Dataset | set04_transDMproB_versus_transDMpreB |
| Phenotype | NoPhenotypeAvailable |
| Upregulated in class | na_pos |
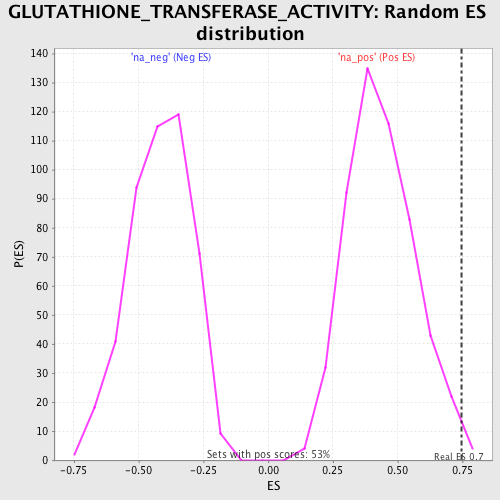
| GeneSet | GLUTATHIONE_TRANSFERASE_ACTIVITY |
| Enrichment Score (ES) | 0.7484144 |
| Normalized Enrichment Score (NES) | 1.715887 |
| Nominal p-value | 0.0075329565 |
| FDR q-value | 0.21684843 |
| FWER p-Value | 0.948 |
| PROBE | GENE SYMBOL | GENE_TITLE | RANK IN GENE LIST | RANK METRIC SCORE | RUNNING ES | CORE ENRICHMENT | |
|---|---|---|---|---|---|---|---|
| 1 | MGST2 | 115 | 16.404 | 0.2841 | Yes | ||
| 2 | GSTT2 | 242 | 12.592 | 0.5001 | Yes | ||
| 3 | GSTM1 | 1469 | 4.655 | 0.5166 | Yes | ||
| 4 | LTC4S | 1499 | 4.563 | 0.5958 | Yes | ||
| 5 | GSTM4 | 1638 | 4.206 | 0.6628 | Yes | ||
| 6 | MGST3 | 1690 | 4.097 | 0.7325 | Yes | ||
| 7 | MGST1 | 2337 | 2.862 | 0.7484 | Yes | ||
| 8 | GSTA4 | 5217 | 0.900 | 0.6096 | No | ||
| 9 | GSTA3 | 6536 | 0.457 | 0.5468 | No | ||
| 10 | GSTM3 | 9656 | -0.383 | 0.3859 | No | ||
| 11 | GSTZ1 | 10519 | -0.607 | 0.3503 | No | ||
| 12 | GSTT1 | 12415 | -1.086 | 0.2677 | No | ||
| 13 | GSTM2 | 12544 | -1.121 | 0.2806 | No | ||
| 14 | GSTM5 | 12725 | -1.179 | 0.2918 | No | ||
| 15 | GSTA2 | 13447 | -1.404 | 0.2779 | No |