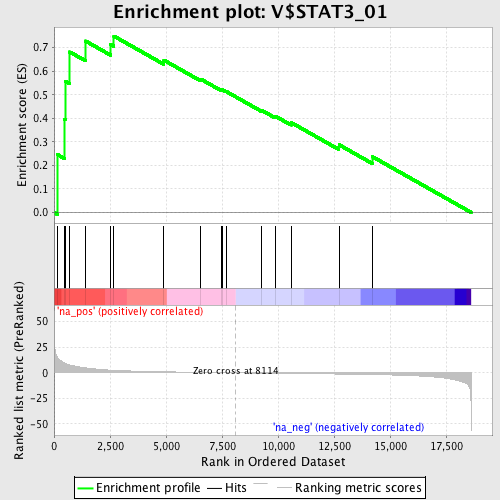
Profile of the Running ES Score & Positions of GeneSet Members on the Rank Ordered List
| Dataset | set04_transDMproB_versus_transDMpreB |
| Phenotype | NoPhenotypeAvailable |
| Upregulated in class | na_pos |
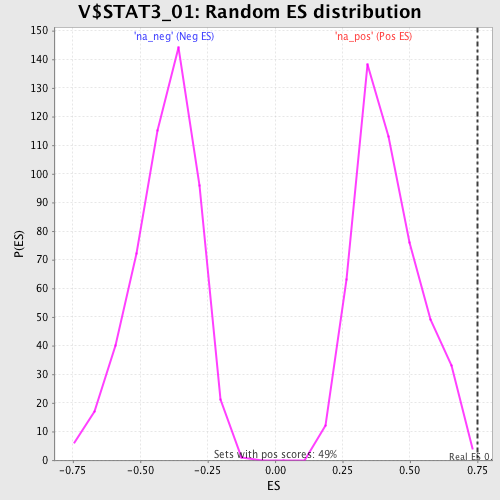
| GeneSet | V$STAT3_01 |
| Enrichment Score (ES) | 0.7492803 |
| Normalized Enrichment Score (NES) | 1.7872682 |
| Nominal p-value | 0.0020491802 |
| FDR q-value | 0.043118007 |
| FWER p-Value | 0.173 |
| PROBE | GENE SYMBOL | GENE_TITLE | RANK IN GENE LIST | RANK METRIC SCORE | RUNNING ES | CORE ENRICHMENT | |
|---|---|---|---|---|---|---|---|
| 1 | CISH | 161 | 14.580 | 0.2453 | Yes | ||
| 2 | PROS1 | 468 | 9.637 | 0.3966 | Yes | ||
| 3 | IRF1 | 496 | 9.365 | 0.5583 | Yes | ||
| 4 | TRAF4 | 700 | 7.724 | 0.6819 | Yes | ||
| 5 | ICAM1 | 1401 | 4.841 | 0.7285 | Yes | ||
| 6 | ELMO1 | 2524 | 2.634 | 0.7141 | Yes | ||
| 7 | APBA1 | 2669 | 2.465 | 0.7493 | Yes | ||
| 8 | SLC38A5 | 4900 | 1.022 | 0.6472 | No | ||
| 9 | UBR1 | 6546 | 0.454 | 0.5666 | No | ||
| 10 | SERPING1 | 7484 | 0.182 | 0.5194 | No | ||
| 11 | CCL2 | 7511 | 0.172 | 0.5210 | No | ||
| 12 | BTBD1 | 7683 | 0.124 | 0.5140 | No | ||
| 13 | ZNF228 | 9277 | -0.297 | 0.4335 | No | ||
| 14 | VIP | 9872 | -0.443 | 0.4093 | No | ||
| 15 | CLDN5 | 10577 | -0.622 | 0.3823 | No | ||
| 16 | MAFF | 12717 | -1.175 | 0.2878 | No | ||
| 17 | HNRPR | 14218 | -1.684 | 0.2365 | No |