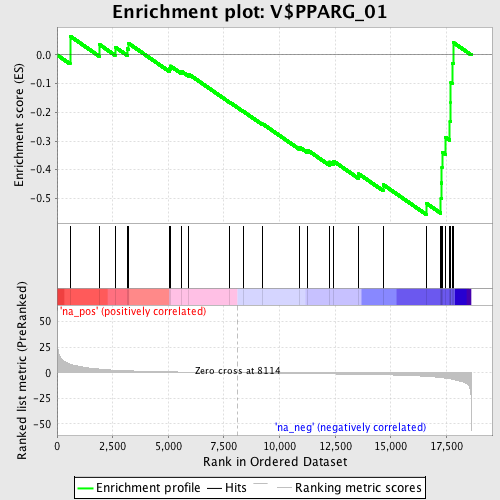
Profile of the Running ES Score & Positions of GeneSet Members on the Rank Ordered List
| Dataset | set04_transDMproB_versus_transDMpreB |
| Phenotype | NoPhenotypeAvailable |
| Upregulated in class | na_neg |
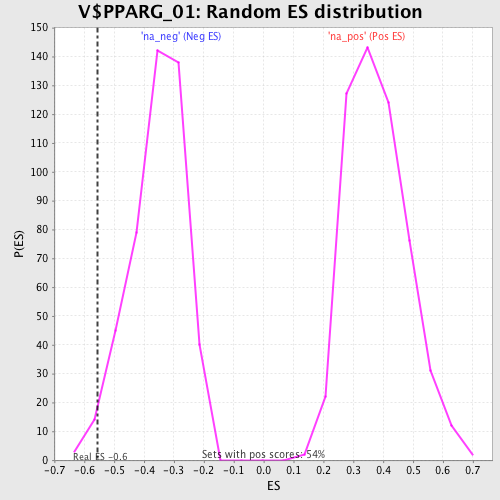
| GeneSet | V$PPARG_01 |
| Enrichment Score (ES) | -0.5562284 |
| Normalized Enrichment Score (NES) | -1.5670594 |
| Nominal p-value | 0.019522777 |
| FDR q-value | 0.08529829 |
| FWER p-Value | 0.808 |
| PROBE | GENE SYMBOL | GENE_TITLE | RANK IN GENE LIST | RANK METRIC SCORE | RUNNING ES | CORE ENRICHMENT | |
|---|---|---|---|---|---|---|---|
| 1 | PPARGC1A | 584 | 8.495 | 0.0657 | No | ||
| 2 | PAK4 | 1900 | 3.637 | 0.0366 | No | ||
| 3 | AP1B1 | 2607 | 2.543 | 0.0277 | No | ||
| 4 | ESRRA | 3153 | 2.011 | 0.0214 | No | ||
| 5 | ZSWIM3 | 3216 | 1.960 | 0.0404 | No | ||
| 6 | HSD17B8 | 5063 | 0.957 | -0.0479 | No | ||
| 7 | PAX7 | 5089 | 0.948 | -0.0384 | No | ||
| 8 | ZIC4 | 5597 | 0.746 | -0.0572 | No | ||
| 9 | GPR124 | 5921 | 0.642 | -0.0672 | No | ||
| 10 | AGPS | 7765 | 0.097 | -0.1652 | No | ||
| 11 | PRRX2 | 8382 | -0.077 | -0.1975 | No | ||
| 12 | RPL27 | 9243 | -0.287 | -0.2405 | No | ||
| 13 | GOLGA4 | 10913 | -0.699 | -0.3223 | No | ||
| 14 | GRPEL1 | 11263 | -0.778 | -0.3322 | No | ||
| 15 | NDUFS1 | 12247 | -1.037 | -0.3732 | No | ||
| 16 | CNTFR | 12433 | -1.091 | -0.3707 | No | ||
| 17 | NR2C1 | 13558 | -1.444 | -0.4146 | No | ||
| 18 | SYT6 | 14656 | -1.881 | -0.4521 | No | ||
| 19 | APOM | 16592 | -3.440 | -0.5169 | Yes | ||
| 20 | SFRS6 | 17254 | -4.671 | -0.4990 | Yes | ||
| 21 | MRPS28 | 17273 | -4.704 | -0.4462 | Yes | ||
| 22 | RQCD1 | 17296 | -4.759 | -0.3930 | Yes | ||
| 23 | USP37 | 17306 | -4.786 | -0.3387 | Yes | ||
| 24 | SNRPF | 17457 | -5.204 | -0.2873 | Yes | ||
| 25 | EEF1B2 | 17658 | -5.823 | -0.2314 | Yes | ||
| 26 | NR2F6 | 17695 | -5.981 | -0.1650 | Yes | ||
| 27 | MAGMAS | 17700 | -6.008 | -0.0965 | Yes | ||
| 28 | DNAJA2 | 17761 | -6.250 | -0.0282 | Yes | ||
| 29 | SMYD5 | 17806 | -6.484 | 0.0436 | Yes |