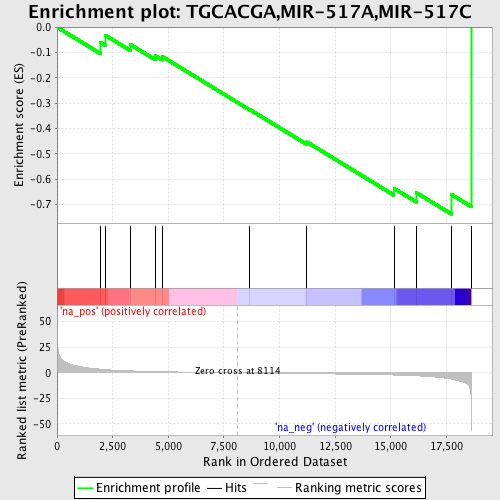
Profile of the Running ES Score & Positions of GeneSet Members on the Rank Ordered List
| Dataset | set04_transDMproB_versus_transDMpreB |
| Phenotype | NoPhenotypeAvailable |
| Upregulated in class | na_neg |
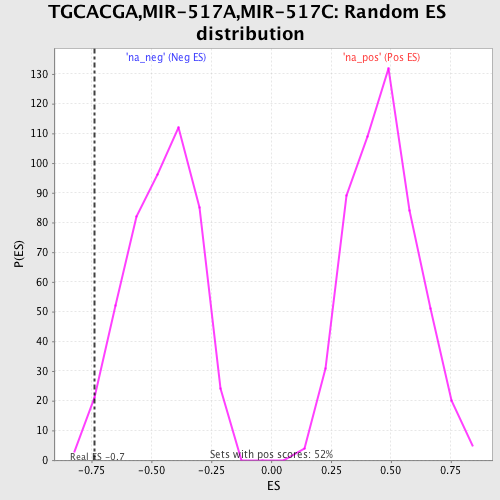
| GeneSet | TGCACGA,MIR-517A,MIR-517C |
| Enrichment Score (ES) | -0.7383924 |
| Normalized Enrichment Score (NES) | -1.6183647 |
| Nominal p-value | 0.012631579 |
| FDR q-value | 0.09866927 |
| FWER p-Value | 0.634 |
| PROBE | GENE SYMBOL | GENE_TITLE | RANK IN GENE LIST | RANK METRIC SCORE | RUNNING ES | CORE ENRICHMENT | |
|---|---|---|---|---|---|---|---|
| 1 | PTK2B | 1955 | 3.523 | -0.0604 | No | ||
| 2 | NPAS4 | 2179 | 3.140 | -0.0326 | No | ||
| 3 | PHF13 | 3309 | 1.889 | -0.0693 | No | ||
| 4 | DBN1 | 4420 | 1.221 | -0.1135 | No | ||
| 5 | CBLN2 | 4724 | 1.095 | -0.1159 | No | ||
| 6 | BSN | 8666 | -0.147 | -0.3258 | No | ||
| 7 | SFRS1 | 11226 | -0.769 | -0.4536 | No | ||
| 8 | AMMECR1 | 15142 | -2.129 | -0.6370 | No | ||
| 9 | HNRPU | 16149 | -2.925 | -0.6540 | No | ||
| 10 | ACACA | 17721 | -6.103 | -0.6610 | Yes | ||
| 11 | CDKN2A | 18616 | -55.900 | -0.0000 | Yes |