Profile of the Running ES Score & Positions of GeneSet Members on the Rank Ordered List
| Dataset | set04_transDMproB_versus_transDMpreB |
| Phenotype | NoPhenotypeAvailable |
| Upregulated in class | na_neg |
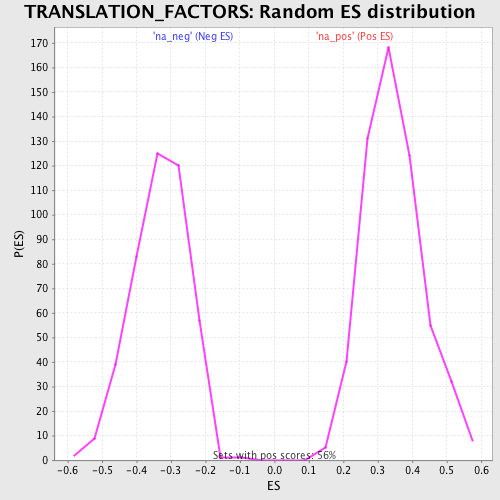
| GeneSet | TRANSLATION_FACTORS |
| Enrichment Score (ES) | -0.7095695 |
| Normalized Enrichment Score (NES) | -2.130058 |
| Nominal p-value | 0.0 |
| FDR q-value | 1.5927602E-4 |
| FWER p-Value | 0.0010 |
| PROBE | GENE SYMBOL | GENE_TITLE | RANK IN GENE LIST | RANK METRIC SCORE | RUNNING ES | CORE ENRICHMENT | |
|---|---|---|---|---|---|---|---|
| 1 | EEF2K | 522 | 9.071 | 0.0119 | No | ||
| 2 | EIF2AK2 | 1005 | 6.237 | 0.0134 | No | ||
| 3 | GSPT2 | 1976 | 3.494 | -0.0234 | No | ||
| 4 | EIF2AK3 | 2372 | 2.811 | -0.0323 | No | ||
| 5 | EIF4EBP2 | 5736 | 0.702 | -0.2102 | No | ||
| 6 | EIF2B2 | 5928 | 0.641 | -0.2177 | No | ||
| 7 | EIF3S5 | 7618 | 0.141 | -0.3080 | No | ||
| 8 | EIF4G3 | 10329 | -0.565 | -0.4514 | No | ||
| 9 | EIF5B | 10985 | -0.712 | -0.4835 | No | ||
| 10 | PAIP1 | 11239 | -0.771 | -0.4938 | No | ||
| 11 | EEF1A2 | 12480 | -1.104 | -0.5556 | No | ||
| 12 | EIF3S3 | 13336 | -1.368 | -0.5956 | No | ||
| 13 | SLC35A4 | 15453 | -2.320 | -0.6993 | Yes | ||
| 14 | EIF3S6 | 15535 | -2.377 | -0.6932 | Yes | ||
| 15 | EIF1AY | 15747 | -2.532 | -0.6934 | Yes | ||
| 16 | ITGB4BP | 15930 | -2.713 | -0.6913 | Yes | ||
| 17 | EIF4A2 | 16158 | -2.931 | -0.6906 | Yes | ||
| 18 | EEF1G | 16196 | -2.966 | -0.6795 | Yes | ||
| 19 | EIF2S1 | 16403 | -3.164 | -0.6766 | Yes | ||
| 20 | EIF3S7 | 16411 | -3.176 | -0.6630 | Yes | ||
| 21 | PABPC1 | 16424 | -3.199 | -0.6495 | Yes | ||
| 22 | EIF4E | 16846 | -3.834 | -0.6553 | Yes | ||
| 23 | EIF3S1 | 17069 | -4.241 | -0.6486 | Yes | ||
| 24 | EEF2 | 17093 | -4.295 | -0.6309 | Yes | ||
| 25 | EIF4G1 | 17226 | -4.598 | -0.6177 | Yes | ||
| 26 | EIF4EBP1 | 17307 | -4.787 | -0.6009 | Yes | ||
| 27 | EIF5 | 17471 | -5.251 | -0.5865 | Yes | ||
| 28 | EEF1B2 | 17658 | -5.823 | -0.5709 | Yes | ||
| 29 | EIF2AK1 | 17665 | -5.861 | -0.5454 | Yes | ||
| 30 | EIF3S10 | 17674 | -5.899 | -0.5198 | Yes | ||
| 31 | EIF3S8 | 17711 | -6.059 | -0.4950 | Yes | ||
| 32 | EIF4A1 | 17715 | -6.081 | -0.4684 | Yes | ||
| 33 | EEF1D | 17960 | -7.198 | -0.4498 | Yes | ||
| 34 | ETF1 | 18075 | -7.847 | -0.4213 | Yes | ||
| 35 | EIF2B5 | 18142 | -8.168 | -0.3888 | Yes | ||
| 36 | EIF5A | 18184 | -8.462 | -0.3537 | Yes | ||
| 37 | EIF2S2 | 18271 | -9.141 | -0.3181 | Yes | ||
| 38 | EIF3S9 | 18431 | -10.898 | -0.2786 | Yes | ||
| 39 | EIF2B4 | 18461 | -11.400 | -0.2299 | Yes | ||
| 40 | EIF2B1 | 18474 | -11.791 | -0.1786 | Yes | ||
| 41 | EIF3S4 | 18513 | -12.772 | -0.1243 | Yes | ||
| 42 | EIF3S2 | 18535 | -13.696 | -0.0650 | Yes | ||
| 43 | EIF2B3 | 18567 | -15.730 | 0.0026 | Yes |