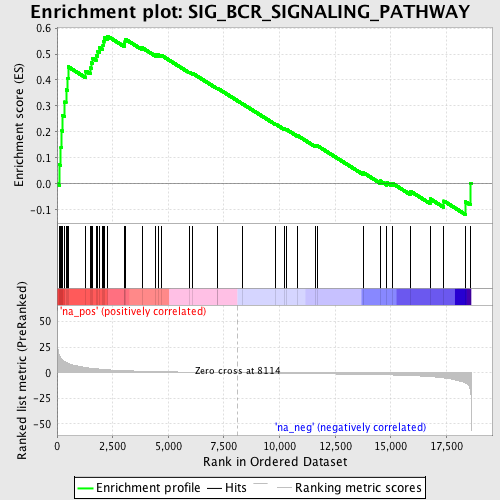
Profile of the Running ES Score & Positions of GeneSet Members on the Rank Ordered List
| Dataset | set04_transDMproB_versus_transDMpreB |
| Phenotype | NoPhenotypeAvailable |
| Upregulated in class | na_pos |
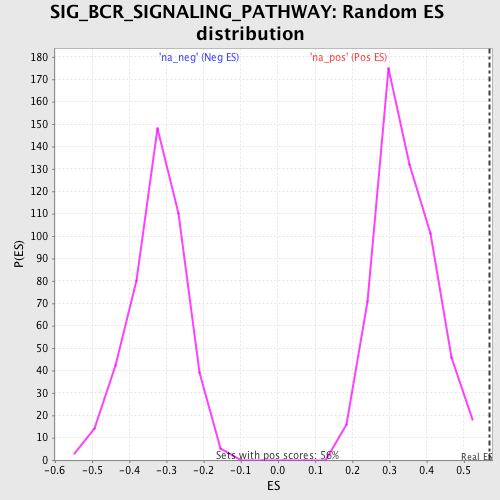
| GeneSet | SIG_BCR_SIGNALING_PATHWAY |
| Enrichment Score (ES) | 0.56893474 |
| Normalized Enrichment Score (NES) | 1.6760318 |
| Nominal p-value | 0.0 |
| FDR q-value | 0.13530697 |
| FWER p-Value | 0.898 |
| PROBE | GENE SYMBOL | GENE_TITLE | RANK IN GENE LIST | RANK METRIC SCORE | RUNNING ES | CORE ENRICHMENT | |
|---|---|---|---|---|---|---|---|
| 1 | CD81 | 119 | 16.052 | 0.0731 | Yes | ||
| 2 | FLOT1 | 170 | 14.242 | 0.1410 | Yes | ||
| 3 | NFATC1 | 213 | 13.199 | 0.2041 | Yes | ||
| 4 | BLNK | 244 | 12.553 | 0.2646 | Yes | ||
| 5 | INPP5D | 333 | 11.185 | 0.3153 | Yes | ||
| 6 | FLOT2 | 402 | 10.326 | 0.3628 | Yes | ||
| 7 | VAV1 | 479 | 9.504 | 0.4058 | Yes | ||
| 8 | BCR | 501 | 9.330 | 0.4509 | Yes | ||
| 9 | PPP3CC | 1281 | 5.185 | 0.4346 | Yes | ||
| 10 | AKT3 | 1488 | 4.622 | 0.4464 | Yes | ||
| 11 | PPP3CB | 1536 | 4.496 | 0.4661 | Yes | ||
| 12 | PIK3CD | 1599 | 4.319 | 0.4842 | Yes | ||
| 13 | CD19 | 1754 | 3.951 | 0.4955 | Yes | ||
| 14 | MAPK3 | 1828 | 3.801 | 0.5104 | Yes | ||
| 15 | GSK3B | 1908 | 3.621 | 0.5240 | Yes | ||
| 16 | BAD | 2058 | 3.344 | 0.5326 | Yes | ||
| 17 | PDK1 | 2072 | 3.307 | 0.5483 | Yes | ||
| 18 | ITPR1 | 2110 | 3.249 | 0.5624 | Yes | ||
| 19 | DAG1 | 2266 | 3.011 | 0.5689 | Yes | ||
| 20 | SOS2 | 3021 | 2.119 | 0.5388 | No | ||
| 21 | PPP3CA | 3049 | 2.097 | 0.5478 | No | ||
| 22 | PLCG2 | 3072 | 2.076 | 0.5569 | No | ||
| 23 | BTK | 3816 | 1.546 | 0.5245 | No | ||
| 24 | PIK3CA | 4439 | 1.215 | 0.4970 | No | ||
| 25 | PIK3R1 | 4537 | 1.166 | 0.4976 | No | ||
| 26 | GRB2 | 4679 | 1.109 | 0.4955 | No | ||
| 27 | SHC1 | 5949 | 0.636 | 0.4303 | No | ||
| 28 | SOS1 | 6098 | 0.595 | 0.4253 | No | ||
| 29 | LYN | 7205 | 0.268 | 0.3671 | No | ||
| 30 | CSK | 7206 | 0.268 | 0.3684 | No | ||
| 31 | ITPR3 | 8344 | -0.069 | 0.3075 | No | ||
| 32 | NFATC2 | 9829 | -0.432 | 0.2297 | No | ||
| 33 | NR0B2 | 10212 | -0.531 | 0.2118 | No | ||
| 34 | PTPRC | 10296 | -0.556 | 0.2101 | No | ||
| 35 | RAF1 | 10793 | -0.671 | 0.1867 | No | ||
| 36 | ITPR2 | 11623 | -0.875 | 0.1464 | No | ||
| 37 | PPP1R13B | 11690 | -0.889 | 0.1472 | No | ||
| 38 | AKT1 | 13777 | -1.515 | 0.0424 | No | ||
| 39 | GSK3A | 14523 | -1.822 | 0.0113 | No | ||
| 40 | AKT2 | 14825 | -1.957 | 0.0048 | No | ||
| 41 | CR2 | 15068 | -2.082 | 0.0021 | No | ||
| 42 | MAPK1 | 15894 | -2.679 | -0.0291 | No | ||
| 43 | BCL2 | 16768 | -3.720 | -0.0576 | No | ||
| 44 | SYK | 17384 | -4.994 | -0.0660 | No | ||
| 45 | MAP4K1 | 18350 | -9.884 | -0.0690 | No | ||
| 46 | CD22 | 18579 | -16.816 | 0.0020 | No |