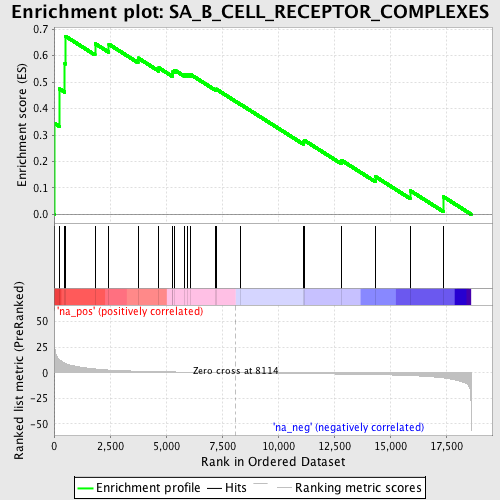
Profile of the Running ES Score & Positions of GeneSet Members on the Rank Ordered List
| Dataset | set04_transDMproB_versus_transDMpreB |
| Phenotype | NoPhenotypeAvailable |
| Upregulated in class | na_pos |
| GeneSet | SA_B_CELL_RECEPTOR_COMPLEXES |
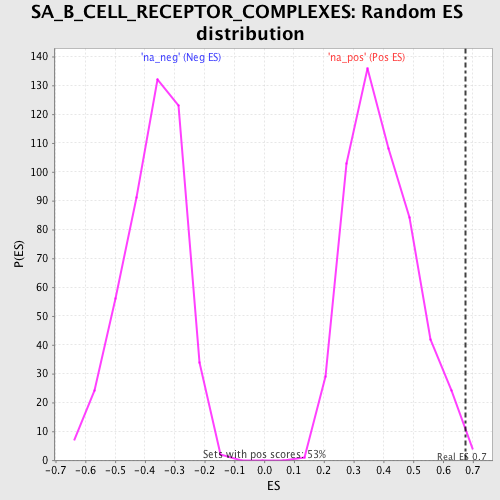
| Enrichment Score (ES) | 0.6741512 |
| Normalized Enrichment Score (NES) | 1.7257088 |
| Nominal p-value | 0.0037664783 |
| FDR q-value | 0.13841617 |
| FWER p-Value | 0.728 |
| PROBE | GENE SYMBOL | GENE_TITLE | RANK IN GENE LIST | RANK METRIC SCORE | RUNNING ES | CORE ENRICHMENT | |
|---|---|---|---|---|---|---|---|
| 1 | VAV3 | 12 | 30.494 | 0.3448 | Yes | ||
| 2 | BLNK | 244 | 12.553 | 0.4745 | Yes | ||
| 3 | VAV1 | 479 | 9.504 | 0.5696 | Yes | ||
| 4 | BCR | 501 | 9.330 | 0.6742 | Yes | ||
| 5 | MAPK3 | 1828 | 3.801 | 0.6459 | No | ||
| 6 | JUN | 2446 | 2.711 | 0.6434 | No | ||
| 7 | RAC1 | 3748 | 1.593 | 0.5915 | No | ||
| 8 | GRB2 | 4679 | 1.109 | 0.5540 | No | ||
| 9 | MAPK8IP3 | 5293 | 0.869 | 0.5309 | No | ||
| 10 | VAV2 | 5303 | 0.865 | 0.5402 | No | ||
| 11 | MAP3K1 | 5375 | 0.838 | 0.5459 | No | ||
| 12 | ATF2 | 5831 | 0.671 | 0.5290 | No | ||
| 13 | SHC1 | 5949 | 0.636 | 0.5299 | No | ||
| 14 | SOS1 | 6098 | 0.595 | 0.5287 | No | ||
| 15 | LYN | 7205 | 0.268 | 0.4723 | No | ||
| 16 | FOS | 7226 | 0.262 | 0.4742 | No | ||
| 17 | RPS6KA3 | 8319 | -0.060 | 0.4161 | No | ||
| 18 | RPS6KA1 | 11121 | -0.744 | 0.2739 | No | ||
| 19 | PAPPA | 11156 | -0.755 | 0.2806 | No | ||
| 20 | HRAS | 12835 | -1.210 | 0.2041 | No | ||
| 21 | MAP2K1 | 14347 | -1.742 | 0.1426 | No | ||
| 22 | MAPK1 | 15894 | -2.679 | 0.0898 | No | ||
| 23 | SYK | 17384 | -4.994 | 0.0663 | No |