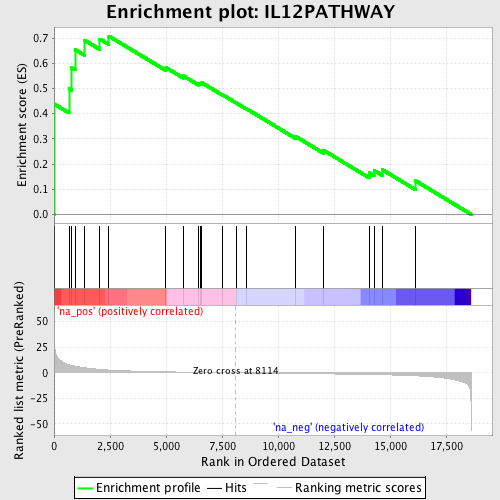
Profile of the Running ES Score & Positions of GeneSet Members on the Rank Ordered List
| Dataset | set04_transDMproB_versus_transDMpreB |
| Phenotype | NoPhenotypeAvailable |
| Upregulated in class | na_pos |
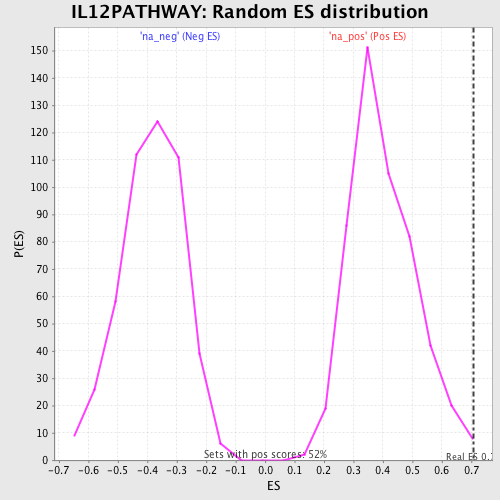
| GeneSet | IL12PATHWAY |
| Enrichment Score (ES) | 0.70814365 |
| Normalized Enrichment Score (NES) | 1.7704879 |
| Nominal p-value | 0.0019417476 |
| FDR q-value | 0.16814895 |
| FWER p-Value | 0.504 |
| PROBE | GENE SYMBOL | GENE_TITLE | RANK IN GENE LIST | RANK METRIC SCORE | RUNNING ES | CORE ENRICHMENT | |
|---|---|---|---|---|---|---|---|
| 1 | STAT4 | 6 | 35.873 | 0.4385 | Yes | ||
| 2 | JAK2 | 667 | 7.896 | 0.4996 | Yes | ||
| 3 | ETV5 | 784 | 7.256 | 0.5821 | Yes | ||
| 4 | IL12A | 937 | 6.582 | 0.6545 | Yes | ||
| 5 | MAPK14 | 1366 | 4.922 | 0.6917 | Yes | ||
| 6 | CXCR3 | 2042 | 3.373 | 0.6967 | Yes | ||
| 7 | JUN | 2446 | 2.711 | 0.7081 | Yes | ||
| 8 | CCR5 | 4992 | 0.981 | 0.5833 | No | ||
| 9 | IL18 | 5768 | 0.692 | 0.5501 | No | ||
| 10 | CD3G | 6444 | 0.488 | 0.5197 | No | ||
| 11 | TYK2 | 6516 | 0.464 | 0.5216 | No | ||
| 12 | CD3D | 6591 | 0.444 | 0.5231 | No | ||
| 13 | CD3E | 7530 | 0.167 | 0.4747 | No | ||
| 14 | IL18R1 | 8154 | -0.010 | 0.4413 | No | ||
| 15 | IL12B | 8571 | -0.125 | 0.4204 | No | ||
| 16 | TRB@ | 10784 | -0.670 | 0.3097 | No | ||
| 17 | IL12RB2 | 12015 | -0.973 | 0.2554 | No | ||
| 18 | MAPK8 | 14071 | -1.628 | 0.1649 | No | ||
| 19 | MAP2K6 | 14286 | -1.709 | 0.1743 | No | ||
| 20 | IFNG | 14643 | -1.874 | 0.1780 | No | ||
| 21 | IL12RB1 | 16133 | -2.907 | 0.1335 | No |