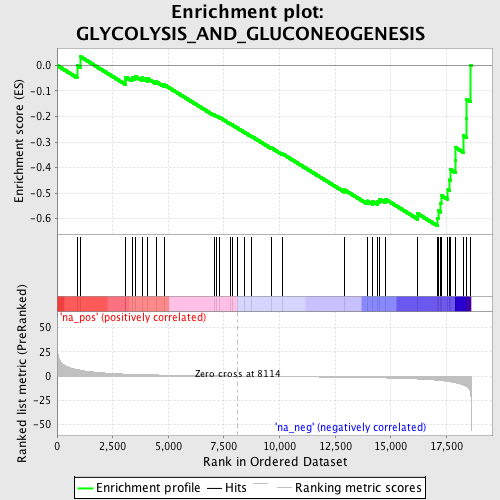
Profile of the Running ES Score & Positions of GeneSet Members on the Rank Ordered List
| Dataset | set04_transDMproB_versus_transDMpreB |
| Phenotype | NoPhenotypeAvailable |
| Upregulated in class | na_neg |
| GeneSet | GLYCOLYSIS_AND_GLUCONEOGENESIS |
| Enrichment Score (ES) | -0.62870646 |
| Normalized Enrichment Score (NES) | -1.871083 |
| Nominal p-value | 0.0 |
| FDR q-value | 0.0077404617 |
| FWER p-Value | 0.125 |
| PROBE | GENE SYMBOL | GENE_TITLE | RANK IN GENE LIST | RANK METRIC SCORE | RUNNING ES | CORE ENRICHMENT | |
|---|---|---|---|---|---|---|---|
| 1 | ALDOC | 896 | 6.759 | -0.0001 | No | ||
| 2 | FBP1 | 1065 | 5.978 | 0.0335 | No | ||
| 3 | FBP2 | 3068 | 2.080 | -0.0595 | No | ||
| 4 | LDHC | 3088 | 2.066 | -0.0458 | No | ||
| 5 | PCK1 | 3369 | 1.837 | -0.0477 | No | ||
| 6 | HK1 | 3502 | 1.740 | -0.0425 | No | ||
| 7 | ALDOB | 3818 | 1.544 | -0.0484 | No | ||
| 8 | HK3 | 4066 | 1.406 | -0.0517 | No | ||
| 9 | PDHB | 4454 | 1.208 | -0.0639 | No | ||
| 10 | PFKM | 4812 | 1.056 | -0.0756 | No | ||
| 11 | LDHAL6B | 7051 | 0.309 | -0.1939 | No | ||
| 12 | GAPDHS | 7174 | 0.276 | -0.1985 | No | ||
| 13 | PFKL | 7315 | 0.233 | -0.2043 | No | ||
| 14 | ENO2 | 7812 | 0.086 | -0.2304 | No | ||
| 15 | PGAM2 | 7874 | 0.068 | -0.2332 | No | ||
| 16 | GCK | 8087 | 0.008 | -0.2446 | No | ||
| 17 | PDHX | 8421 | -0.085 | -0.2619 | No | ||
| 18 | PDHA2 | 8738 | -0.166 | -0.2777 | No | ||
| 19 | PKLR | 9615 | -0.375 | -0.3222 | No | ||
| 20 | G6PC | 10136 | -0.511 | -0.3466 | No | ||
| 21 | GAPDH | 12913 | -1.236 | -0.4872 | No | ||
| 22 | PGK2 | 13934 | -1.581 | -0.5308 | No | ||
| 23 | DLAT | 14168 | -1.665 | -0.5315 | No | ||
| 24 | PDHA1 | 14407 | -1.766 | -0.5317 | No | ||
| 25 | MDH1 | 14500 | -1.811 | -0.5238 | No | ||
| 26 | PGK1 | 14776 | -1.934 | -0.5248 | No | ||
| 27 | ALDOA | 16213 | -2.983 | -0.5809 | No | ||
| 28 | ENO3 | 17103 | -4.313 | -0.5980 | Yes | ||
| 29 | MDH2 | 17125 | -4.377 | -0.5679 | Yes | ||
| 30 | DLD | 17246 | -4.647 | -0.5413 | Yes | ||
| 31 | ENO1 | 17258 | -4.676 | -0.5085 | Yes | ||
| 32 | PKM2 | 17569 | -5.551 | -0.4857 | Yes | ||
| 33 | PFKP | 17649 | -5.794 | -0.4486 | Yes | ||
| 34 | GOT1 | 17686 | -5.940 | -0.4083 | Yes | ||
| 35 | PGAM1 | 17906 | -6.912 | -0.3708 | Yes | ||
| 36 | GOT2 | 17914 | -6.948 | -0.3217 | Yes | ||
| 37 | TPI1 | 18268 | -9.130 | -0.2756 | Yes | ||
| 38 | TNFAIP1 | 18401 | -10.555 | -0.2075 | Yes | ||
| 39 | LDHA | 18407 | -10.608 | -0.1322 | Yes | ||
| 40 | HK2 | 18597 | -20.121 | 0.0010 | Yes |
