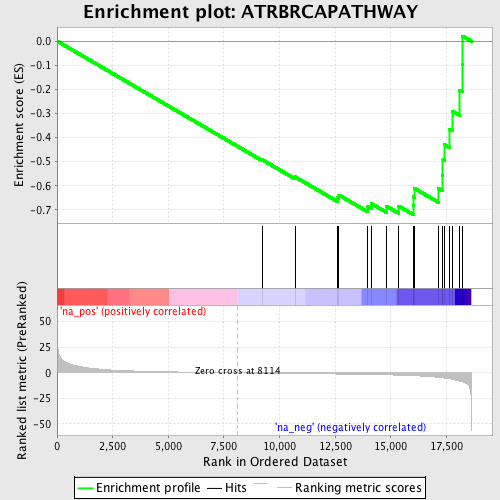
Profile of the Running ES Score & Positions of GeneSet Members on the Rank Ordered List
| Dataset | set04_transDMproB_versus_transDMpreB |
| Phenotype | NoPhenotypeAvailable |
| Upregulated in class | na_neg |
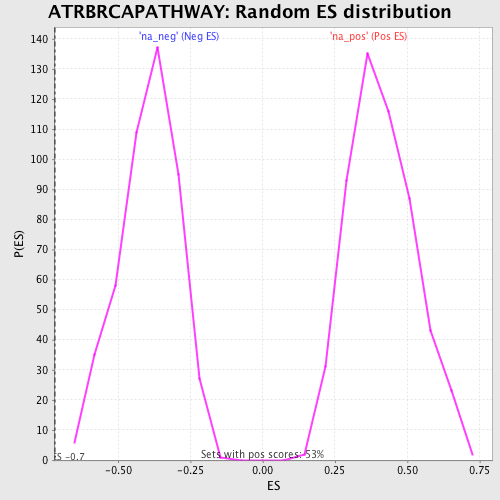
| GeneSet | ATRBRCAPATHWAY |
| Enrichment Score (ES) | -0.7187855 |
| Normalized Enrichment Score (NES) | -1.8206517 |
| Nominal p-value | 0.0 |
| FDR q-value | 0.014055834 |
| FWER p-Value | 0.255 |
| PROBE | GENE SYMBOL | GENE_TITLE | RANK IN GENE LIST | RANK METRIC SCORE | RUNNING ES | CORE ENRICHMENT | |
|---|---|---|---|---|---|---|---|
| 1 | FANCC | 9232 | -0.285 | -0.4927 | No | ||
| 2 | FANCA | 10694 | -0.647 | -0.5627 | No | ||
| 3 | BRCA2 | 12605 | -1.142 | -0.6503 | No | ||
| 4 | TP53 | 12667 | -1.162 | -0.6382 | No | ||
| 5 | BRCA1 | 13970 | -1.594 | -0.6871 | Yes | ||
| 6 | RAD1 | 14121 | -1.648 | -0.6734 | Yes | ||
| 7 | FANCG | 14804 | -1.950 | -0.6843 | Yes | ||
| 8 | RAD17 | 15363 | -2.262 | -0.6844 | Yes | ||
| 9 | RAD50 | 16004 | -2.788 | -0.6819 | Yes | ||
| 10 | RAD9A | 16016 | -2.798 | -0.6455 | Yes | ||
| 11 | CHEK1 | 16056 | -2.832 | -0.6102 | Yes | ||
| 12 | FANCE | 17131 | -4.384 | -0.6099 | Yes | ||
| 13 | MRE11A | 17329 | -4.842 | -0.5565 | Yes | ||
| 14 | CHEK2 | 17344 | -4.882 | -0.4927 | Yes | ||
| 15 | HUS1 | 17418 | -5.066 | -0.4296 | Yes | ||
| 16 | ATM | 17624 | -5.720 | -0.3650 | Yes | ||
| 17 | RAD51 | 17755 | -6.221 | -0.2897 | Yes | ||
| 18 | ATR | 18100 | -7.945 | -0.2032 | Yes | ||
| 19 | TREX1 | 18210 | -8.616 | -0.0951 | Yes | ||
| 20 | FANCD2 | 18230 | -8.839 | 0.0208 | Yes |