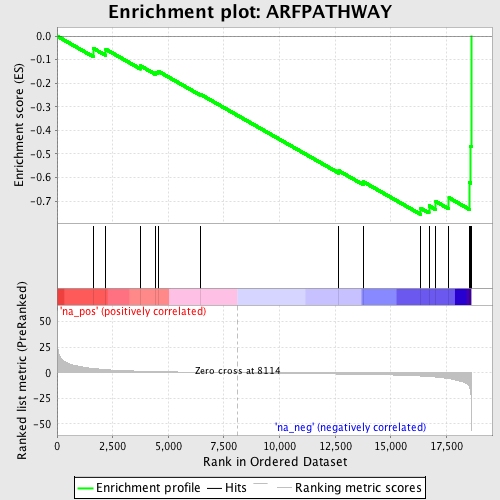
Profile of the Running ES Score & Positions of GeneSet Members on the Rank Ordered List
| Dataset | set04_transDMproB_versus_transDMpreB |
| Phenotype | NoPhenotypeAvailable |
| Upregulated in class | na_neg |
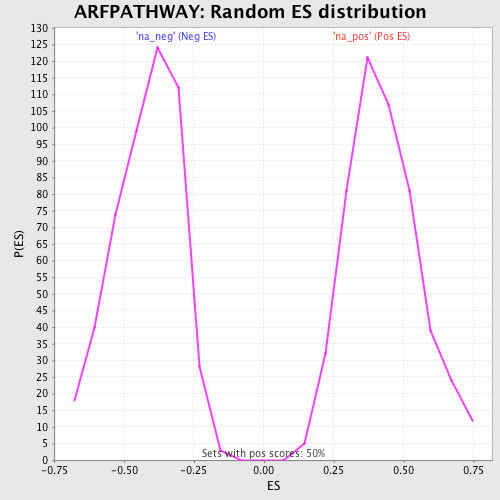
| GeneSet | ARFPATHWAY |
| Enrichment Score (ES) | -0.75685716 |
| Normalized Enrichment Score (NES) | -1.816461 |
| Nominal p-value | 0.0 |
| FDR q-value | 0.0141501445 |
| FWER p-Value | 0.267 |
| PROBE | GENE SYMBOL | GENE_TITLE | RANK IN GENE LIST | RANK METRIC SCORE | RUNNING ES | CORE ENRICHMENT | |
|---|---|---|---|---|---|---|---|
| 1 | ABL1 | 1628 | 4.243 | -0.0519 | No | ||
| 2 | MDM2 | 2191 | 3.125 | -0.0559 | No | ||
| 3 | RAC1 | 3748 | 1.593 | -0.1262 | No | ||
| 4 | PIK3CA | 4439 | 1.215 | -0.1531 | No | ||
| 5 | PIK3R1 | 4537 | 1.166 | -0.1486 | No | ||
| 6 | RB1 | 6458 | 0.483 | -0.2477 | No | ||
| 7 | TP53 | 12667 | -1.162 | -0.5717 | No | ||
| 8 | TBX2 | 13774 | -1.515 | -0.6185 | No | ||
| 9 | MYC | 16349 | -3.119 | -0.7307 | Yes | ||
| 10 | POLR1D | 16717 | -3.627 | -0.7200 | Yes | ||
| 11 | TWIST1 | 17022 | -4.143 | -0.7016 | Yes | ||
| 12 | E2F1 | 17613 | -5.669 | -0.6858 | Yes | ||
| 13 | POLR1A | 18533 | -13.643 | -0.6208 | Yes | ||
| 14 | POLR1B | 18591 | -18.659 | -0.4674 | Yes | ||
| 15 | CDKN2A | 18616 | -55.900 | 0.0000 | Yes |