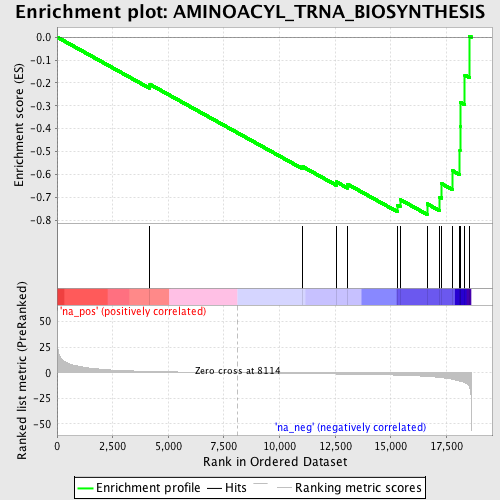
Profile of the Running ES Score & Positions of GeneSet Members on the Rank Ordered List
| Dataset | set04_transDMproB_versus_transDMpreB |
| Phenotype | NoPhenotypeAvailable |
| Upregulated in class | na_neg |
| GeneSet | AMINOACYL_TRNA_BIOSYNTHESIS |
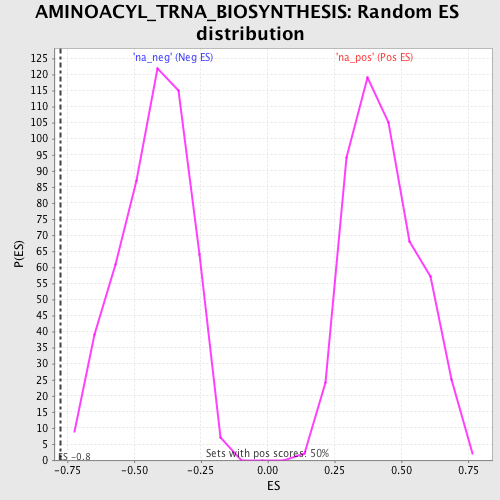
| Enrichment Score (ES) | -0.77463275 |
| Normalized Enrichment Score (NES) | -1.8138424 |
| Nominal p-value | 0.0 |
| FDR q-value | 0.013401841 |
| FWER p-Value | 0.281 |
| PROBE | GENE SYMBOL | GENE_TITLE | RANK IN GENE LIST | RANK METRIC SCORE | RUNNING ES | CORE ENRICHMENT | |
|---|---|---|---|---|---|---|---|
| 1 | HARS | 4168 | 1.350 | -0.2062 | No | ||
| 2 | FARS2 | 11046 | -0.726 | -0.5662 | No | ||
| 3 | EPRS | 12548 | -1.122 | -0.6321 | No | ||
| 4 | YARS | 13057 | -1.279 | -0.6424 | No | ||
| 5 | WARS2 | 15306 | -2.222 | -0.7338 | Yes | ||
| 6 | CARS | 15420 | -2.295 | -0.7095 | Yes | ||
| 7 | WARS | 16633 | -3.503 | -0.7282 | Yes | ||
| 8 | IARS | 17202 | -4.540 | -0.6986 | Yes | ||
| 9 | LARS2 | 17287 | -4.738 | -0.6403 | Yes | ||
| 10 | KARS | 17763 | -6.269 | -0.5828 | Yes | ||
| 11 | NARS | 18105 | -7.963 | -0.4956 | Yes | ||
| 12 | TARS | 18113 | -8.005 | -0.3899 | Yes | ||
| 13 | DARS | 18121 | -8.041 | -0.2837 | Yes | ||
| 14 | GARS | 18328 | -9.686 | -0.1664 | Yes | ||
| 15 | RARS | 18536 | -13.724 | 0.0043 | Yes |