Profile of the Running ES Score & Positions of GeneSet Members on the Rank Ordered List
| Dataset | set04_transDMproB_versus_transDMpreB |
| Phenotype | NoPhenotypeAvailable |
| Upregulated in class | na_neg |
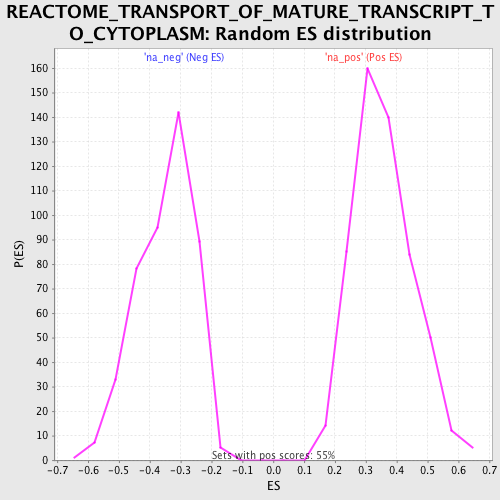
| GeneSet | REACTOME_TRANSPORT_OF_MATURE_TRANSCRIPT_TO_CYTOPLASM |
| Enrichment Score (ES) | -0.75826216 |
| Normalized Enrichment Score (NES) | -2.1704066 |
| Nominal p-value | 0.0 |
| FDR q-value | 0.0 |
| FWER p-Value | 0.0 |
| PROBE | GENE SYMBOL | GENE_TITLE | RANK IN GENE LIST | RANK METRIC SCORE | RUNNING ES | CORE ENRICHMENT | |
|---|---|---|---|---|---|---|---|
| 1 | NUP153 | 3923 | 1.488 | -0.2002 | No | ||
| 2 | SFRS7 | 4053 | 1.412 | -0.1967 | No | ||
| 3 | NUP35 | 5157 | 0.923 | -0.2493 | No | ||
| 4 | SFRS3 | 5496 | 0.795 | -0.2616 | No | ||
| 5 | NUP188 | 10250 | -0.543 | -0.5134 | No | ||
| 6 | SLBP | 11204 | -0.766 | -0.5590 | No | ||
| 7 | SFRS1 | 11226 | -0.769 | -0.5545 | No | ||
| 8 | SRRM1 | 11348 | -0.799 | -0.5551 | No | ||
| 9 | TPR | 11570 | -0.859 | -0.5607 | No | ||
| 10 | U2AF2 | 15127 | -2.117 | -0.7365 | No | ||
| 11 | SFRS9 | 15184 | -2.148 | -0.7237 | No | ||
| 12 | MAGOH | 15827 | -2.618 | -0.7390 | Yes | ||
| 13 | NUP62 | 16047 | -2.825 | -0.7300 | Yes | ||
| 14 | THOC4 | 16343 | -3.113 | -0.7230 | Yes | ||
| 15 | SFRS5 | 16445 | -3.226 | -0.7047 | Yes | ||
| 16 | NFX1 | 16582 | -3.424 | -0.6868 | Yes | ||
| 17 | EIF4E | 16846 | -3.834 | -0.6728 | Yes | ||
| 18 | RANBP2 | 17117 | -4.366 | -0.6552 | Yes | ||
| 19 | NUP37 | 17123 | -4.373 | -0.6233 | Yes | ||
| 20 | SFRS6 | 17254 | -4.671 | -0.5960 | Yes | ||
| 21 | CPSF1 | 17324 | -4.825 | -0.5642 | Yes | ||
| 22 | RNPS1 | 17326 | -4.839 | -0.5287 | Yes | ||
| 23 | NCBP2 | 17500 | -5.321 | -0.4988 | Yes | ||
| 24 | SFRS2 | 17611 | -5.660 | -0.4631 | Yes | ||
| 25 | NUP155 | 17680 | -5.908 | -0.4233 | Yes | ||
| 26 | NUP54 | 17873 | -6.727 | -0.3842 | Yes | ||
| 27 | NUP160 | 17895 | -6.857 | -0.3349 | Yes | ||
| 28 | NUPL2 | 17956 | -7.172 | -0.2854 | Yes | ||
| 29 | U2AF1 | 18107 | -7.981 | -0.2348 | Yes | ||
| 30 | NUP93 | 18153 | -8.220 | -0.1767 | Yes | ||
| 31 | RAE1 | 18164 | -8.331 | -0.1160 | Yes | ||
| 32 | NUP107 | 18278 | -9.225 | -0.0542 | Yes | ||
| 33 | NUP43 | 18346 | -9.841 | 0.0145 | Yes |