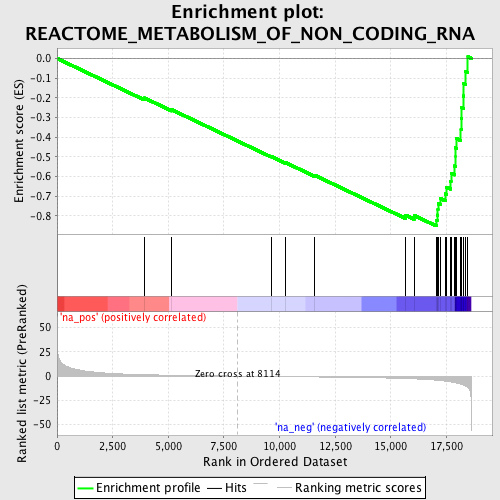
Profile of the Running ES Score & Positions of GeneSet Members on the Rank Ordered List
| Dataset | set04_transDMproB_versus_transDMpreB |
| Phenotype | NoPhenotypeAvailable |
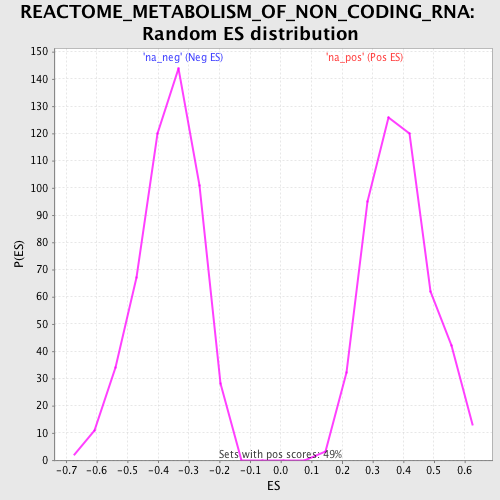
| Upregulated in class | na_neg |
| GeneSet | REACTOME_METABOLISM_OF_NON_CODING_RNA |
| Enrichment Score (ES) | -0.8516332 |
| Normalized Enrichment Score (NES) | -2.323444 |
| Nominal p-value | 0.0 |
| FDR q-value | 0.0 |
| FWER p-Value | 0.0 |
| PROBE | GENE SYMBOL | GENE_TITLE | RANK IN GENE LIST | RANK METRIC SCORE | RUNNING ES | CORE ENRICHMENT | |
|---|---|---|---|---|---|---|---|
| 1 | NUP153 | 3923 | 1.488 | -0.2009 | No | ||
| 2 | NUP35 | 5157 | 0.923 | -0.2609 | No | ||
| 3 | SNRPE | 9624 | -0.376 | -0.4985 | No | ||
| 4 | NUP188 | 10250 | -0.543 | -0.5284 | No | ||
| 5 | TPR | 11570 | -0.859 | -0.5935 | No | ||
| 6 | SNRPG | 15665 | -2.464 | -0.7969 | No | ||
| 7 | NUP62 | 16047 | -2.825 | -0.7981 | No | ||
| 8 | SIP1 | 17044 | -4.196 | -0.8229 | Yes | ||
| 9 | SNRPD3 | 17084 | -4.270 | -0.7958 | Yes | ||
| 10 | RANBP2 | 17117 | -4.366 | -0.7677 | Yes | ||
| 11 | NUP37 | 17123 | -4.373 | -0.7380 | Yes | ||
| 12 | SNRPD2 | 17243 | -4.639 | -0.7127 | Yes | ||
| 13 | SNRPF | 17457 | -5.204 | -0.6886 | Yes | ||
| 14 | NCBP2 | 17500 | -5.321 | -0.6544 | Yes | ||
| 15 | NUP155 | 17680 | -5.908 | -0.6237 | Yes | ||
| 16 | GEMIN4 | 17708 | -6.053 | -0.5837 | Yes | ||
| 17 | NUP54 | 17873 | -6.727 | -0.5465 | Yes | ||
| 18 | NUP160 | 17895 | -6.857 | -0.5008 | Yes | ||
| 19 | SNUPN | 17898 | -6.884 | -0.4538 | Yes | ||
| 20 | NUPL2 | 17956 | -7.172 | -0.4078 | Yes | ||
| 21 | NUP93 | 18153 | -8.220 | -0.3621 | Yes | ||
| 22 | RAE1 | 18164 | -8.331 | -0.3057 | Yes | ||
| 23 | CLNS1A | 18185 | -8.469 | -0.2488 | Yes | ||
| 24 | SNRPB | 18260 | -9.079 | -0.1907 | Yes | ||
| 25 | NUP107 | 18278 | -9.225 | -0.1285 | Yes | ||
| 26 | NUP43 | 18346 | -9.841 | -0.0648 | Yes | ||
| 27 | PRMT5 | 18466 | -11.592 | 0.0081 | Yes |