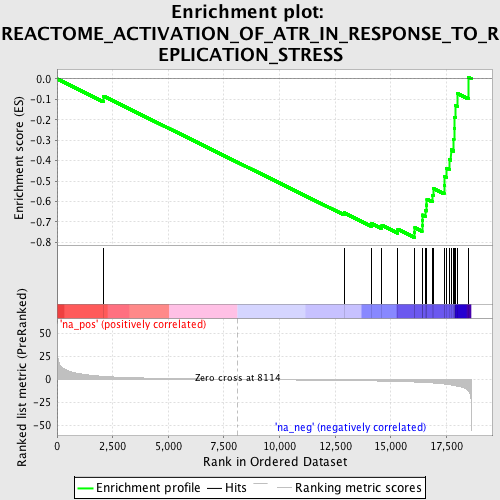
Profile of the Running ES Score & Positions of GeneSet Members on the Rank Ordered List
| Dataset | set04_transDMproB_versus_transDMpreB |
| Phenotype | NoPhenotypeAvailable |
| Upregulated in class | na_neg |
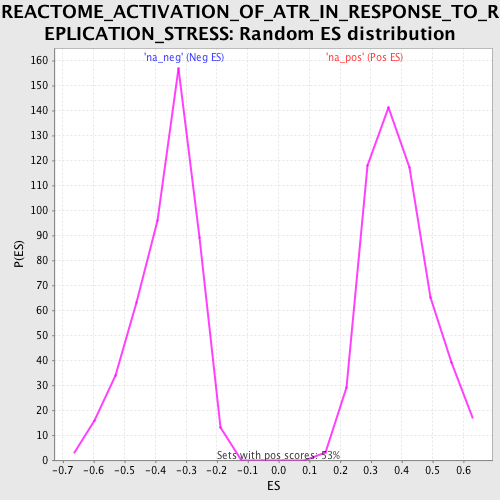
| GeneSet | REACTOME_ACTIVATION_OF_ATR_IN_RESPONSE_TO_REPLICATION_STRESS |
| Enrichment Score (ES) | -0.7759383 |
| Normalized Enrichment Score (NES) | -2.1220987 |
| Nominal p-value | 0.0 |
| FDR q-value | 1.8095606E-4 |
| FWER p-Value | 0.0030 |
| PROBE | GENE SYMBOL | GENE_TITLE | RANK IN GENE LIST | RANK METRIC SCORE | RUNNING ES | CORE ENRICHMENT | |
|---|---|---|---|---|---|---|---|
| 1 | CDC25C | 2082 | 3.290 | -0.0839 | No | ||
| 2 | RPA1 | 12898 | -1.231 | -0.6552 | No | ||
| 3 | RAD1 | 14121 | -1.648 | -0.7068 | No | ||
| 4 | MCM6 | 14599 | -1.854 | -0.7167 | No | ||
| 5 | MCM5 | 15314 | -2.227 | -0.7361 | No | ||
| 6 | CHEK1 | 16056 | -2.832 | -0.7518 | Yes | ||
| 7 | CDC7 | 16081 | -2.853 | -0.7287 | Yes | ||
| 8 | MCM2 | 16404 | -3.166 | -0.7190 | Yes | ||
| 9 | ORC4L | 16414 | -3.183 | -0.6924 | Yes | ||
| 10 | RFC3 | 16431 | -3.206 | -0.6659 | Yes | ||
| 11 | MCM7 | 16549 | -3.369 | -0.6434 | Yes | ||
| 12 | RPA3 | 16606 | -3.458 | -0.6170 | Yes | ||
| 13 | MCM4 | 16623 | -3.480 | -0.5881 | Yes | ||
| 14 | CDK2 | 16879 | -3.891 | -0.5687 | Yes | ||
| 15 | MCM3 | 16907 | -3.932 | -0.5366 | Yes | ||
| 16 | CDC25A | 17396 | -5.014 | -0.5200 | Yes | ||
| 17 | HUS1 | 17418 | -5.066 | -0.4779 | Yes | ||
| 18 | RPA2 | 17511 | -5.355 | -0.4372 | Yes | ||
| 19 | CDC45L | 17635 | -5.759 | -0.3947 | Yes | ||
| 20 | RAD9B | 17704 | -6.020 | -0.3470 | Yes | ||
| 21 | ORC2L | 17822 | -6.535 | -0.2975 | Yes | ||
| 22 | MCM10 | 17841 | -6.601 | -0.2422 | Yes | ||
| 23 | ORC1L | 17868 | -6.700 | -0.1864 | Yes | ||
| 24 | RFC5 | 17910 | -6.942 | -0.1294 | Yes | ||
| 25 | RFC4 | 18000 | -7.383 | -0.0712 | Yes | ||
| 26 | ORC5L | 18491 | -12.227 | 0.0067 | Yes |