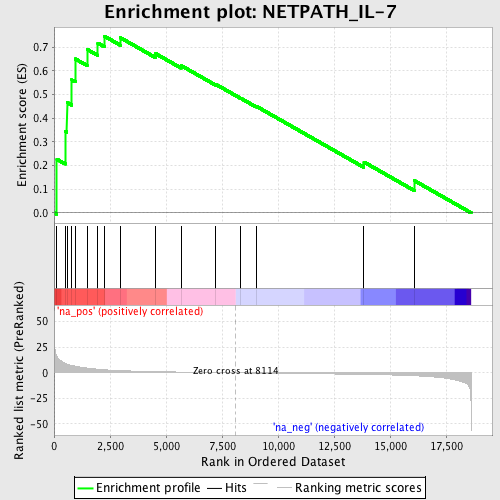
Profile of the Running ES Score & Positions of GeneSet Members on the Rank Ordered List
| Dataset | set04_transDMproB_versus_transDMpreB |
| Phenotype | NoPhenotypeAvailable |
| Upregulated in class | na_pos |
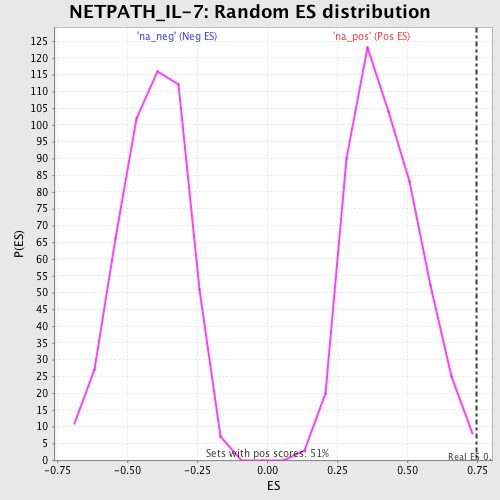
| GeneSet | NETPATH_IL-7 |
| Enrichment Score (ES) | 0.7466281 |
| Normalized Enrichment Score (NES) | 1.7739422 |
| Nominal p-value | 0.001968504 |
| FDR q-value | 0.12172131 |
| FWER p-Value | 0.67 |
| PROBE | GENE SYMBOL | GENE_TITLE | RANK IN GENE LIST | RANK METRIC SCORE | RUNNING ES | CORE ENRICHMENT | |
|---|---|---|---|---|---|---|---|
| 1 | JAK3 | 126 | 15.779 | 0.2263 | Yes | ||
| 2 | IL7R | 498 | 9.353 | 0.3445 | Yes | ||
| 3 | FYN | 575 | 8.548 | 0.4666 | Yes | ||
| 4 | STAT3 | 790 | 7.215 | 0.5617 | Yes | ||
| 5 | STAT5A | 947 | 6.564 | 0.6503 | Yes | ||
| 6 | IL7 | 1475 | 4.642 | 0.6905 | Yes | ||
| 7 | PTK2B | 1955 | 3.523 | 0.7168 | Yes | ||
| 8 | MCL1 | 2240 | 3.055 | 0.7466 | Yes | ||
| 9 | JAK1 | 2969 | 2.161 | 0.7394 | No | ||
| 10 | PIK3R1 | 4537 | 1.166 | 0.6724 | No | ||
| 11 | STAT5B | 5666 | 0.724 | 0.6224 | No | ||
| 12 | LYN | 7205 | 0.268 | 0.5437 | No | ||
| 13 | IRS1 | 8331 | -0.064 | 0.4842 | No | ||
| 14 | IL2RG | 9022 | -0.235 | 0.4506 | No | ||
| 15 | INSL3 | 13832 | -1.541 | 0.2148 | No | ||
| 16 | BCL2L11 | 16098 | -2.867 | 0.1354 | No |