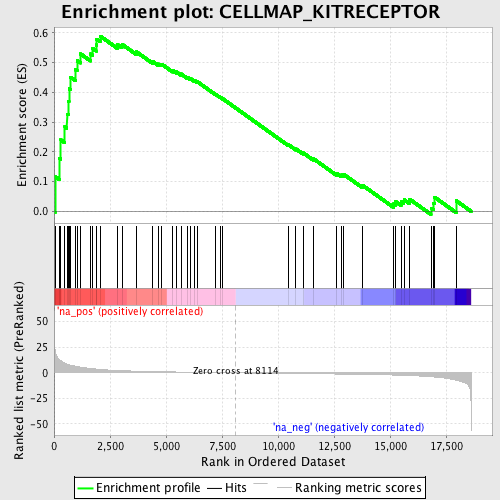
Profile of the Running ES Score & Positions of GeneSet Members on the Rank Ordered List
| Dataset | set04_transDMproB_versus_transDMpreB |
| Phenotype | NoPhenotypeAvailable |
| Upregulated in class | na_pos |
| GeneSet | CELLMAP_KITRECEPTOR |
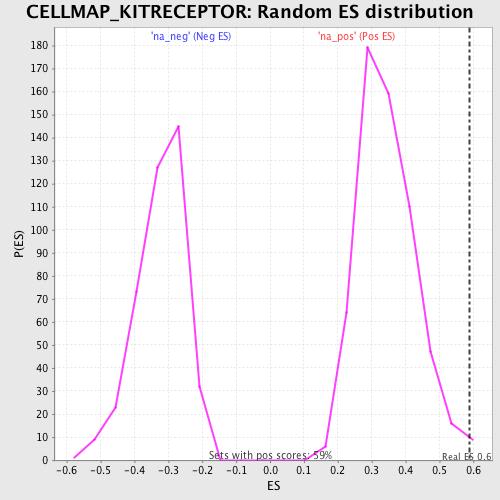
| Enrichment Score (ES) | 0.589414 |
| Normalized Enrichment Score (NES) | 1.7099106 |
| Nominal p-value | 0.008474576 |
| FDR q-value | 0.17430806 |
| FWER p-Value | 0.921 |
| PROBE | GENE SYMBOL | GENE_TITLE | RANK IN GENE LIST | RANK METRIC SCORE | RUNNING ES | CORE ENRICHMENT | |
|---|---|---|---|---|---|---|---|
| 1 | KIT | 44 | 21.341 | 0.1176 | Yes | ||
| 2 | GRB7 | 241 | 12.611 | 0.1779 | Yes | ||
| 3 | STAT1 | 300 | 11.691 | 0.2405 | Yes | ||
| 4 | VAV1 | 479 | 9.504 | 0.2844 | Yes | ||
| 5 | FYN | 575 | 8.548 | 0.3273 | Yes | ||
| 6 | SH3KBP1 | 633 | 8.165 | 0.3701 | Yes | ||
| 7 | JAK2 | 667 | 7.896 | 0.4128 | Yes | ||
| 8 | FES | 732 | 7.513 | 0.4515 | Yes | ||
| 9 | STAT5A | 947 | 6.564 | 0.4769 | Yes | ||
| 10 | PIK3CG | 1028 | 6.132 | 0.5071 | Yes | ||
| 11 | MATK | 1180 | 5.474 | 0.5297 | Yes | ||
| 12 | ABL1 | 1628 | 4.243 | 0.5295 | Yes | ||
| 13 | RASA1 | 1707 | 4.056 | 0.5481 | Yes | ||
| 14 | CRKL | 1876 | 3.698 | 0.5598 | Yes | ||
| 15 | SPRED2 | 1896 | 3.640 | 0.5793 | Yes | ||
| 16 | BAD | 2058 | 3.344 | 0.5894 | Yes | ||
| 17 | SOCS5 | 2819 | 2.312 | 0.5615 | No | ||
| 18 | EPOR | 3032 | 2.109 | 0.5619 | No | ||
| 19 | KITLG | 3672 | 1.641 | 0.5367 | No | ||
| 20 | MITF | 4405 | 1.227 | 0.5042 | No | ||
| 21 | GRB2 | 4679 | 1.109 | 0.4957 | No | ||
| 22 | SOCS6 | 4806 | 1.058 | 0.4949 | No | ||
| 23 | FGR | 5294 | 0.868 | 0.4736 | No | ||
| 24 | DOK1 | 5459 | 0.809 | 0.4693 | No | ||
| 25 | STAT5B | 5666 | 0.724 | 0.4622 | No | ||
| 26 | SHC1 | 5949 | 0.636 | 0.4506 | No | ||
| 27 | SOS1 | 6098 | 0.595 | 0.4460 | No | ||
| 28 | HCK | 6249 | 0.547 | 0.4410 | No | ||
| 29 | CLTC | 6388 | 0.504 | 0.4364 | No | ||
| 30 | LYN | 7205 | 0.268 | 0.3940 | No | ||
| 31 | PRKCA | 7416 | 0.203 | 0.3838 | No | ||
| 32 | YES1 | 7535 | 0.166 | 0.3784 | No | ||
| 33 | SRC | 10441 | -0.590 | 0.2252 | No | ||
| 34 | RAF1 | 10793 | -0.671 | 0.2101 | No | ||
| 35 | RPS6KA1 | 11121 | -0.744 | 0.1967 | No | ||
| 36 | PLCG1 | 11581 | -0.861 | 0.1768 | No | ||
| 37 | PLCE1 | 12606 | -1.142 | 0.1281 | No | ||
| 38 | HRAS | 12835 | -1.210 | 0.1226 | No | ||
| 39 | SPRED1 | 12934 | -1.240 | 0.1243 | No | ||
| 40 | AKT1 | 13777 | -1.515 | 0.0875 | No | ||
| 41 | PTPN11 | 15159 | -2.141 | 0.0251 | No | ||
| 42 | CBL | 15237 | -2.177 | 0.0332 | No | ||
| 43 | PIK3R2 | 15490 | -2.342 | 0.0328 | No | ||
| 44 | KHDRBS1 | 15619 | -2.432 | 0.0396 | No | ||
| 45 | GRAP | 15873 | -2.654 | 0.0409 | No | ||
| 46 | CRK | 16826 | -3.808 | 0.0110 | No | ||
| 47 | CBLB | 16935 | -3.978 | 0.0275 | No | ||
| 48 | SOCS1 | 16975 | -4.049 | 0.0482 | No | ||
| 49 | PTPN6 | 17950 | -7.136 | 0.0359 | No |