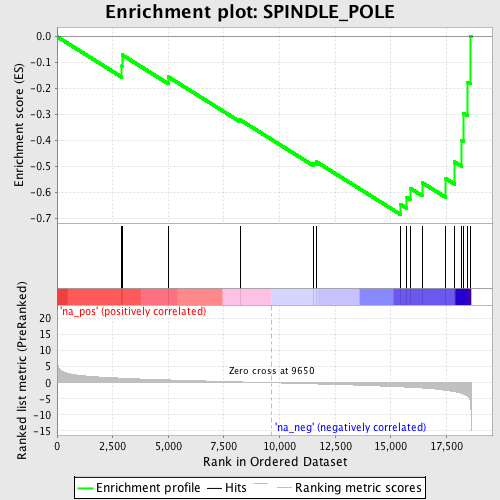
Profile of the Running ES Score & Positions of GeneSet Members on the Rank Ordered List
| Dataset | set04_transDMproB_versus_LMproB |
| Phenotype | NoPhenotypeAvailable |
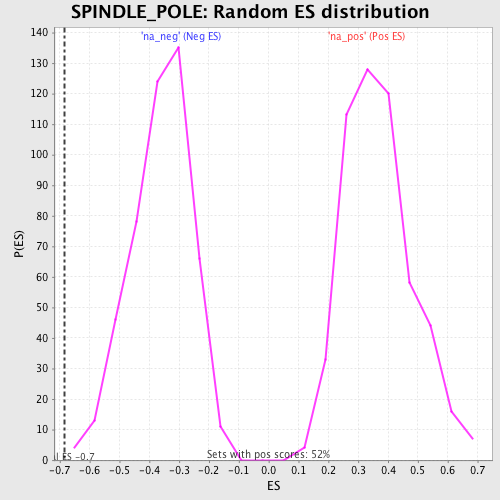
| Upregulated in class | na_neg |
| GeneSet | SPINDLE_POLE |
| Enrichment Score (ES) | -0.6856975 |
| Normalized Enrichment Score (NES) | -1.902286 |
| Nominal p-value | 0.002096436 |
| FDR q-value | 0.045520276 |
| FWER p-Value | 0.459 |
| PROBE | GENE SYMBOL | GENE_TITLE | RANK IN GENE LIST | RANK METRIC SCORE | RUNNING ES | CORE ENRICHMENT | |
|---|---|---|---|---|---|---|---|
| 1 | TUBGCP3 | 2912 | 1.413 | -0.1131 | No | ||
| 2 | LATS2 | 2920 | 1.410 | -0.0701 | No | ||
| 3 | KATNA1 | 5004 | 0.872 | -0.1553 | No | ||
| 4 | BUB1 | 8225 | 0.254 | -0.3206 | No | ||
| 5 | CETN1 | 11531 | -0.350 | -0.4876 | No | ||
| 6 | KIF11 | 11659 | -0.378 | -0.4828 | No | ||
| 7 | KNTC1 | 15435 | -1.269 | -0.6467 | Yes | ||
| 8 | SMC3 | 15722 | -1.364 | -0.6201 | Yes | ||
| 9 | ZW10 | 15866 | -1.415 | -0.5843 | Yes | ||
| 10 | CENPF | 16425 | -1.644 | -0.5638 | Yes | ||
| 11 | TPX2 | 17473 | -2.353 | -0.5477 | Yes | ||
| 12 | NUMA1 | 17864 | -2.791 | -0.4829 | Yes | ||
| 13 | DCTN1 | 18194 | -3.290 | -0.3995 | Yes | ||
| 14 | DLG7 | 18270 | -3.498 | -0.2959 | Yes | ||
| 15 | NDE1 | 18455 | -4.231 | -0.1758 | Yes | ||
| 16 | TUBG1 | 18578 | -5.997 | 0.0020 | Yes |