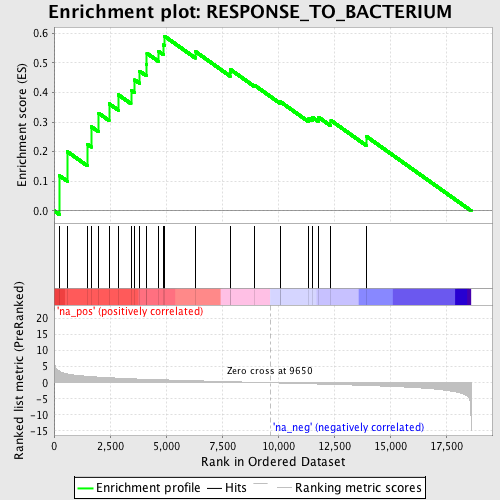
Profile of the Running ES Score & Positions of GeneSet Members on the Rank Ordered List
| Dataset | set04_transDMproB_versus_LMproB |
| Phenotype | NoPhenotypeAvailable |
| Upregulated in class | na_pos |
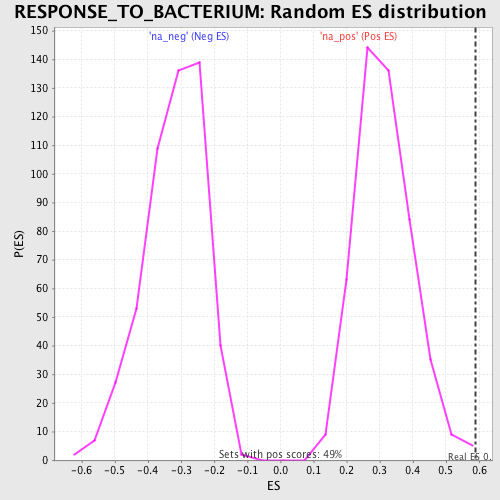
| GeneSet | RESPONSE_TO_BACTERIUM |
| Enrichment Score (ES) | 0.59028894 |
| Normalized Enrichment Score (NES) | 1.8914351 |
| Nominal p-value | 0.006185567 |
| FDR q-value | 0.087395124 |
| FWER p-Value | 0.539 |
| PROBE | GENE SYMBOL | GENE_TITLE | RANK IN GENE LIST | RANK METRIC SCORE | RUNNING ES | CORE ENRICHMENT | |
|---|---|---|---|---|---|---|---|
| 1 | BCL10 | 229 | 3.599 | 0.1194 | Yes | ||
| 2 | NOD1 | 594 | 2.735 | 0.1999 | Yes | ||
| 3 | TLR6 | 1478 | 1.983 | 0.2249 | Yes | ||
| 4 | IL10 | 1655 | 1.888 | 0.2845 | Yes | ||
| 5 | SPN | 1993 | 1.729 | 0.3297 | Yes | ||
| 6 | TLR3 | 2454 | 1.562 | 0.3621 | Yes | ||
| 7 | PGLYRP1 | 2869 | 1.428 | 0.3920 | Yes | ||
| 8 | CD24 | 3433 | 1.247 | 0.4074 | Yes | ||
| 9 | SLC11A1 | 3599 | 1.196 | 0.4422 | Yes | ||
| 10 | NOD2 | 3813 | 1.137 | 0.4724 | Yes | ||
| 11 | SPACA3 | 4123 | 1.065 | 0.4947 | Yes | ||
| 12 | DEFB127 | 4144 | 1.060 | 0.5324 | Yes | ||
| 13 | CAMP | 4670 | 0.941 | 0.5386 | Yes | ||
| 14 | DEFB103A | 4873 | 0.900 | 0.5607 | Yes | ||
| 15 | NLRC4 | 4925 | 0.885 | 0.5903 | Yes | ||
| 16 | PGLYRP2 | 6304 | 0.610 | 0.5385 | No | ||
| 17 | CHIT1 | 7857 | 0.319 | 0.4667 | No | ||
| 18 | LALBA | 7871 | 0.316 | 0.4775 | No | ||
| 19 | DMBT1 | 8945 | 0.126 | 0.4245 | No | ||
| 20 | CFP | 10089 | -0.084 | 0.3661 | No | ||
| 21 | WFDC12 | 10102 | -0.086 | 0.3686 | No | ||
| 22 | STAB2 | 11373 | -0.321 | 0.3120 | No | ||
| 23 | STAB1 | 11530 | -0.350 | 0.3164 | No | ||
| 24 | PGLYRP4 | 11796 | -0.404 | 0.3169 | No | ||
| 25 | PGLYRP3 | 12358 | -0.511 | 0.3054 | No | ||
| 26 | IL12A | 13937 | -0.851 | 0.2517 | No |