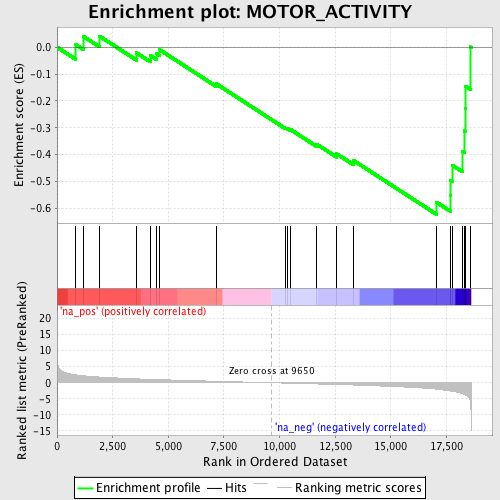
Profile of the Running ES Score & Positions of GeneSet Members on the Rank Ordered List
| Dataset | set04_transDMproB_versus_LMproB |
| Phenotype | NoPhenotypeAvailable |
| Upregulated in class | na_neg |
| GeneSet | MOTOR_ACTIVITY |
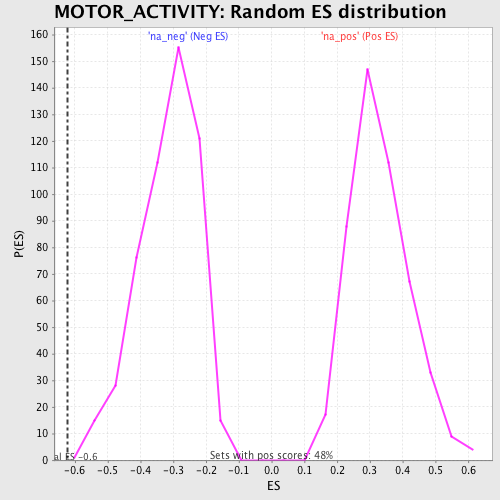
| Enrichment Score (ES) | -0.62276596 |
| Normalized Enrichment Score (NES) | -1.9712124 |
| Nominal p-value | 0.0019120459 |
| FDR q-value | 0.040524647 |
| FWER p-Value | 0.226 |
| PROBE | GENE SYMBOL | GENE_TITLE | RANK IN GENE LIST | RANK METRIC SCORE | RUNNING ES | CORE ENRICHMENT | |
|---|---|---|---|---|---|---|---|
| 1 | MYL6 | 843 | 2.441 | 0.0096 | No | ||
| 2 | DNALI1 | 1176 | 2.174 | 0.0407 | No | ||
| 3 | APPBP2 | 1902 | 1.769 | 0.0415 | No | ||
| 4 | KIF1B | 3566 | 1.205 | -0.0208 | No | ||
| 5 | MYH2 | 4197 | 1.048 | -0.0311 | No | ||
| 6 | MYO6 | 4460 | 0.988 | -0.0229 | No | ||
| 7 | KIFC3 | 4596 | 0.960 | -0.0086 | No | ||
| 8 | KIF5B | 7155 | 0.443 | -0.1362 | No | ||
| 9 | MYO1E | 10281 | -0.116 | -0.3016 | No | ||
| 10 | CENPE | 10373 | -0.134 | -0.3035 | No | ||
| 11 | DYNC1I1 | 10474 | -0.153 | -0.3054 | No | ||
| 12 | KIF11 | 11659 | -0.378 | -0.3606 | No | ||
| 13 | BBS4 | 12560 | -0.551 | -0.3966 | No | ||
| 14 | GRIN1 | 13310 | -0.705 | -0.4210 | No | ||
| 15 | MYO3A | 17062 | -2.005 | -0.5776 | Yes | ||
| 16 | MYH9 | 17671 | -2.566 | -0.5526 | Yes | ||
| 17 | KIF22 | 17690 | -2.585 | -0.4954 | Yes | ||
| 18 | KIF23 | 17755 | -2.653 | -0.4391 | Yes | ||
| 19 | KIF4A | 18219 | -3.367 | -0.3882 | Yes | ||
| 20 | MYO9B | 18314 | -3.639 | -0.3114 | Yes | ||
| 21 | KIF5C | 18339 | -3.737 | -0.2285 | Yes | ||
| 22 | KIF2C | 18349 | -3.764 | -0.1443 | Yes | ||
| 23 | MYH10 | 18593 | -7.046 | 0.0012 | Yes |