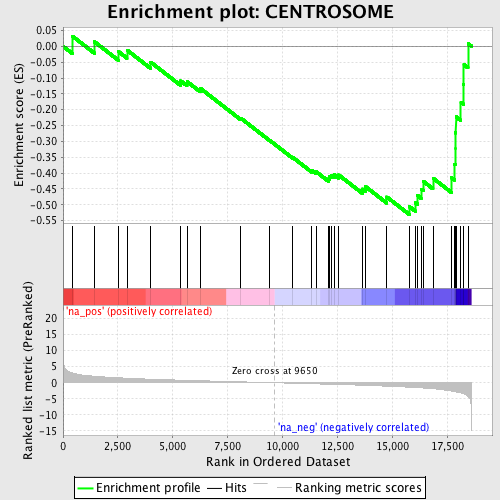
Profile of the Running ES Score & Positions of GeneSet Members on the Rank Ordered List
| Dataset | set04_transDMproB_versus_LMproB |
| Phenotype | NoPhenotypeAvailable |
| Upregulated in class | na_neg |
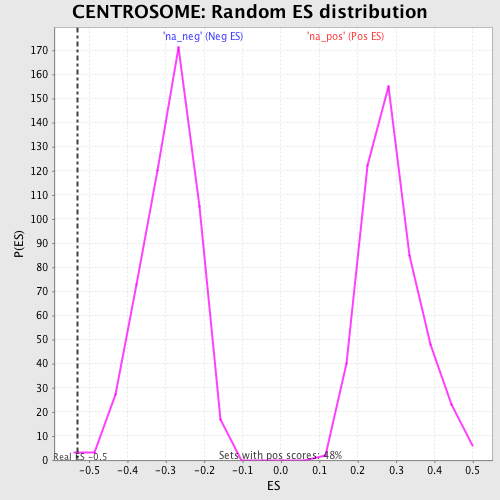
| GeneSet | CENTROSOME |
| Enrichment Score (ES) | -0.53067386 |
| Normalized Enrichment Score (NES) | -1.8280169 |
| Nominal p-value | 0.0019267823 |
| FDR q-value | 0.06906889 |
| FWER p-Value | 0.748 |
| PROBE | GENE SYMBOL | GENE_TITLE | RANK IN GENE LIST | RANK METRIC SCORE | RUNNING ES | CORE ENRICHMENT | |
|---|---|---|---|---|---|---|---|
| 1 | DCTN4 | 421 | 3.028 | 0.0322 | No | ||
| 2 | NUDT21 | 1434 | 2.011 | 0.0142 | No | ||
| 3 | UXT | 2523 | 1.536 | -0.0165 | No | ||
| 4 | TUBGCP3 | 2912 | 1.413 | -0.0118 | No | ||
| 5 | CETN3 | 3986 | 1.097 | -0.0497 | No | ||
| 6 | NEK2 | 5362 | 0.796 | -0.1092 | No | ||
| 7 | AURKC | 5648 | 0.737 | -0.1112 | No | ||
| 8 | PPP4R2 | 6252 | 0.619 | -0.1325 | No | ||
| 9 | LCK | 8104 | 0.275 | -0.2271 | No | ||
| 10 | NPM1 | 9417 | 0.047 | -0.2969 | No | ||
| 11 | CDC16 | 10470 | -0.152 | -0.3507 | No | ||
| 12 | RABGAP1 | 11337 | -0.315 | -0.3916 | No | ||
| 13 | CETN1 | 11531 | -0.350 | -0.3957 | No | ||
| 14 | CLASP1 | 12111 | -0.462 | -0.4185 | No | ||
| 15 | TOP2A | 12133 | -0.467 | -0.4111 | No | ||
| 16 | TSGA14 | 12214 | -0.483 | -0.4067 | No | ||
| 17 | BIRC5 | 12364 | -0.512 | -0.4054 | No | ||
| 18 | BBS4 | 12560 | -0.551 | -0.4059 | No | ||
| 19 | APC | 13647 | -0.781 | -0.4502 | No | ||
| 20 | KIF15 | 13789 | -0.817 | -0.4430 | No | ||
| 21 | ALMS1 | 14753 | -1.069 | -0.4755 | No | ||
| 22 | ALS2 | 15780 | -1.381 | -0.5056 | Yes | ||
| 23 | TUBE1 | 16068 | -1.496 | -0.4940 | Yes | ||
| 24 | MARK4 | 16155 | -1.533 | -0.4708 | Yes | ||
| 25 | MAP3K11 | 16319 | -1.593 | -0.4507 | Yes | ||
| 26 | BRCA2 | 16426 | -1.645 | -0.4266 | Yes | ||
| 27 | NIN | 16859 | -1.867 | -0.4160 | Yes | ||
| 28 | PCM1 | 17694 | -2.587 | -0.4140 | Yes | ||
| 29 | PLK1 | 17847 | -2.764 | -0.3721 | Yes | ||
| 30 | TUBD1 | 17871 | -2.798 | -0.3227 | Yes | ||
| 31 | AZI1 | 17874 | -2.801 | -0.2720 | Yes | ||
| 32 | AKAP9 | 17906 | -2.828 | -0.2224 | Yes | ||
| 33 | MPHOSPH1 | 18133 | -3.184 | -0.1769 | Yes | ||
| 34 | DCTN2 | 18256 | -3.458 | -0.1208 | Yes | ||
| 35 | DLG7 | 18270 | -3.498 | -0.0581 | Yes | ||
| 36 | NDE1 | 18455 | -4.231 | 0.0087 | Yes |