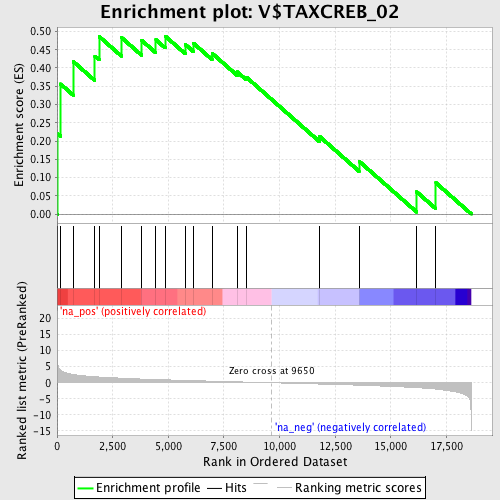
Profile of the Running ES Score & Positions of GeneSet Members on the Rank Ordered List
| Dataset | set04_transDMproB_versus_LMproB |
| Phenotype | NoPhenotypeAvailable |
| Upregulated in class | na_pos |
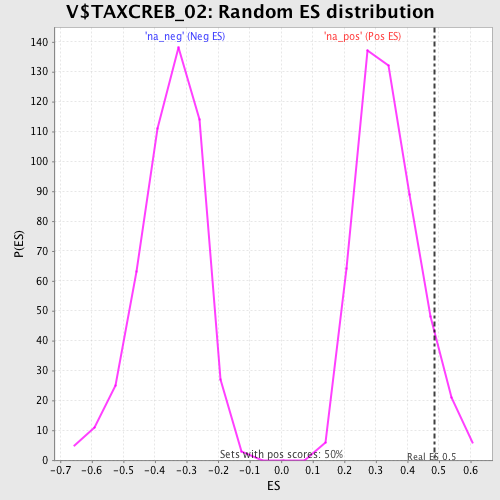
| GeneSet | V$TAXCREB_02 |
| Enrichment Score (ES) | 0.4873077 |
| Normalized Enrichment Score (NES) | 1.4427106 |
| Nominal p-value | 0.077534795 |
| FDR q-value | 0.87864876 |
| FWER p-Value | 0.999 |
| PROBE | GENE SYMBOL | GENE_TITLE | RANK IN GENE LIST | RANK METRIC SCORE | RUNNING ES | CORE ENRICHMENT | |
|---|---|---|---|---|---|---|---|
| 1 | EMP3 | 23 | 6.144 | 0.2200 | Yes | ||
| 2 | SERTAD1 | 152 | 3.974 | 0.3563 | Yes | ||
| 3 | ARIH1 | 728 | 2.561 | 0.4176 | Yes | ||
| 4 | ADIPOR2 | 1698 | 1.866 | 0.4327 | Yes | ||
| 5 | EEF1A1 | 1894 | 1.773 | 0.4860 | Yes | ||
| 6 | JAG1 | 2892 | 1.417 | 0.4835 | Yes | ||
| 7 | PPP1R11 | 3805 | 1.140 | 0.4755 | Yes | ||
| 8 | SSBP3 | 4441 | 0.995 | 0.4772 | Yes | ||
| 9 | BCL11A | 4859 | 0.903 | 0.4873 | Yes | ||
| 10 | STX12 | 5765 | 0.711 | 0.4643 | No | ||
| 11 | S100A10 | 6130 | 0.640 | 0.4677 | No | ||
| 12 | CAPN6 | 6968 | 0.483 | 0.4401 | No | ||
| 13 | DLK1 | 8097 | 0.276 | 0.3894 | No | ||
| 14 | OTP | 8510 | 0.205 | 0.3747 | No | ||
| 15 | CRLF1 | 11789 | -0.403 | 0.2129 | No | ||
| 16 | NAB2 | 13574 | -0.764 | 0.1445 | No | ||
| 17 | LIN28 | 16164 | -1.537 | 0.0607 | No | ||
| 18 | NKX2-3 | 17027 | -1.974 | 0.0854 | No |