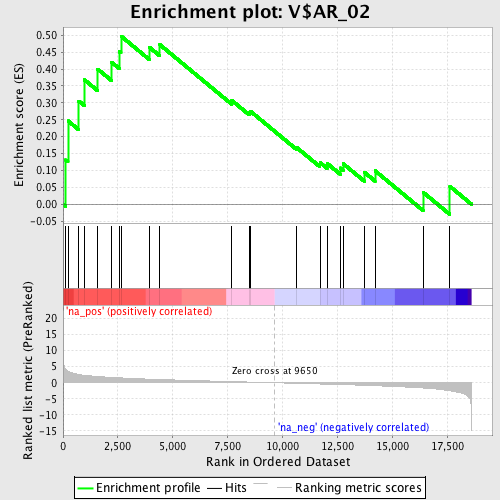
Profile of the Running ES Score & Positions of GeneSet Members on the Rank Ordered List
| Dataset | set04_transDMproB_versus_LMproB |
| Phenotype | NoPhenotypeAvailable |
| Upregulated in class | na_pos |
| GeneSet | V$AR_02 |
| Enrichment Score (ES) | 0.4972412 |
| Normalized Enrichment Score (NES) | 1.5270534 |
| Nominal p-value | 0.029045643 |
| FDR q-value | 1.0 |
| FWER p-Value | 0.955 |
| PROBE | GENE SYMBOL | GENE_TITLE | RANK IN GENE LIST | RANK METRIC SCORE | RUNNING ES | CORE ENRICHMENT | |
|---|---|---|---|---|---|---|---|
| 1 | BCL6 | 124 | 4.169 | 0.1312 | Yes | ||
| 2 | CHCHD7 | 223 | 3.653 | 0.2467 | Yes | ||
| 3 | PPP1CC | 715 | 2.574 | 0.3054 | Yes | ||
| 4 | PLAG1 | 975 | 2.315 | 0.3680 | Yes | ||
| 5 | TIMM8A | 1571 | 1.933 | 0.3999 | Yes | ||
| 6 | NCDN | 2216 | 1.645 | 0.4197 | Yes | ||
| 7 | SCNN1A | 2559 | 1.527 | 0.4518 | Yes | ||
| 8 | LOX | 2639 | 1.503 | 0.4972 | Yes | ||
| 9 | SLC7A8 | 3937 | 1.107 | 0.4641 | No | ||
| 10 | IL27 | 4407 | 1.002 | 0.4720 | No | ||
| 11 | GOT2 | 7688 | 0.349 | 0.3071 | No | ||
| 12 | FIGN | 8488 | 0.210 | 0.2711 | No | ||
| 13 | RWDD1 | 8536 | 0.201 | 0.2752 | No | ||
| 14 | EPHA7 | 10653 | -0.183 | 0.1675 | No | ||
| 15 | KCTD4 | 11708 | -0.388 | 0.1237 | No | ||
| 16 | KCNJ1 | 12033 | -0.448 | 0.1210 | No | ||
| 17 | DNAJB4 | 12634 | -0.565 | 0.1074 | No | ||
| 18 | SMOX | 12763 | -0.592 | 0.1201 | No | ||
| 19 | FGF17 | 13739 | -0.805 | 0.0943 | No | ||
| 20 | PHC2 | 14219 | -0.923 | 0.0991 | No | ||
| 21 | TENC1 | 16409 | -1.637 | 0.0355 | No | ||
| 22 | ADCY6 | 17629 | -2.514 | 0.0531 | No |
