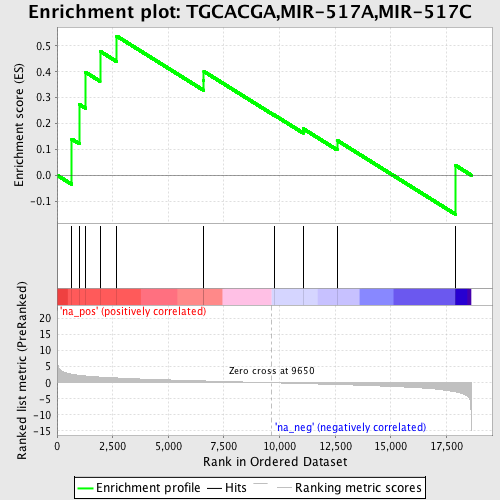
Profile of the Running ES Score & Positions of GeneSet Members on the Rank Ordered List
| Dataset | set04_transDMproB_versus_LMproB |
| Phenotype | NoPhenotypeAvailable |
| Upregulated in class | na_pos |
| GeneSet | TGCACGA,MIR-517A,MIR-517C |
| Enrichment Score (ES) | 0.5377178 |
| Normalized Enrichment Score (NES) | 1.3579751 |
| Nominal p-value | 0.111561865 |
| FDR q-value | 0.88462526 |
| FWER p-Value | 1.0 |
| PROBE | GENE SYMBOL | GENE_TITLE | RANK IN GENE LIST | RANK METRIC SCORE | RUNNING ES | CORE ENRICHMENT | |
|---|---|---|---|---|---|---|---|
| 1 | CDKN2A | 661 | 2.646 | 0.1396 | Yes | ||
| 2 | NPAS4 | 995 | 2.299 | 0.2739 | Yes | ||
| 3 | DBN1 | 1286 | 2.106 | 0.3977 | Yes | ||
| 4 | PHF13 | 1928 | 1.756 | 0.4796 | Yes | ||
| 5 | PTK2B | 2682 | 1.490 | 0.5377 | Yes | ||
| 6 | CBLN2 | 6585 | 0.559 | 0.3650 | No | ||
| 7 | SFRS1 | 6599 | 0.557 | 0.4012 | No | ||
| 8 | AMMECR1 | 9754 | -0.021 | 0.2331 | No | ||
| 9 | HNRPU | 11060 | -0.256 | 0.1799 | No | ||
| 10 | BSN | 12587 | -0.557 | 0.1347 | No | ||
| 11 | ACACA | 17919 | -2.859 | 0.0375 | No |
