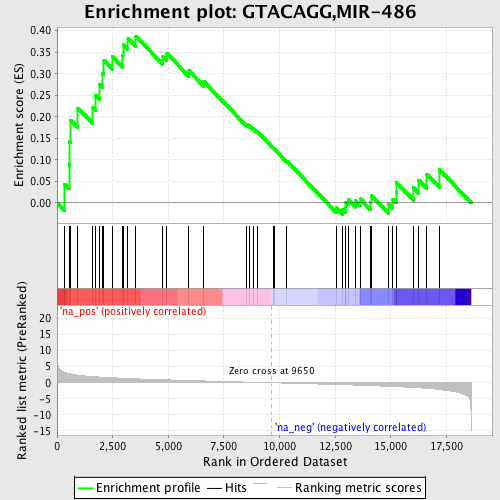
Profile of the Running ES Score & Positions of GeneSet Members on the Rank Ordered List
| Dataset | set04_transDMproB_versus_LMproB |
| Phenotype | NoPhenotypeAvailable |
| Upregulated in class | na_pos |
| GeneSet | GTACAGG,MIR-486 |
| Enrichment Score (ES) | 0.38734275 |
| Normalized Enrichment Score (NES) | 1.4215744 |
| Nominal p-value | 0.042826552 |
| FDR q-value | 0.79253143 |
| FWER p-Value | 1.0 |
| PROBE | GENE SYMBOL | GENE_TITLE | RANK IN GENE LIST | RANK METRIC SCORE | RUNNING ES | CORE ENRICHMENT | |
|---|---|---|---|---|---|---|---|
| 1 | FOXO1A | 347 | 3.220 | 0.0439 | Yes | ||
| 2 | CUGBP2 | 539 | 2.833 | 0.0886 | Yes | ||
| 3 | DYNLL1 | 556 | 2.791 | 0.1419 | Yes | ||
| 4 | PIK3R1 | 600 | 2.724 | 0.1925 | Yes | ||
| 5 | SFRS3 | 934 | 2.346 | 0.2201 | Yes | ||
| 6 | DOCK3 | 1611 | 1.913 | 0.2209 | Yes | ||
| 7 | ARMC8 | 1737 | 1.850 | 0.2501 | Yes | ||
| 8 | PTEN | 1917 | 1.762 | 0.2746 | Yes | ||
| 9 | UNC5C | 2038 | 1.709 | 0.3014 | Yes | ||
| 10 | TOB1 | 2103 | 1.682 | 0.3306 | Yes | ||
| 11 | PTPN12 | 2478 | 1.552 | 0.3406 | Yes | ||
| 12 | SRF | 2954 | 1.397 | 0.3422 | Yes | ||
| 13 | PUM2 | 2963 | 1.393 | 0.3688 | Yes | ||
| 14 | FGF13 | 3185 | 1.323 | 0.3826 | Yes | ||
| 15 | STK4 | 3535 | 1.212 | 0.3873 | Yes | ||
| 16 | CNTNAP4 | 4758 | 0.923 | 0.3395 | No | ||
| 17 | MAP3K7 | 4921 | 0.886 | 0.3479 | No | ||
| 18 | SORCS1 | 5926 | 0.678 | 0.3071 | No | ||
| 19 | SFRS1 | 6599 | 0.557 | 0.2817 | No | ||
| 20 | ELAVL2 | 8504 | 0.207 | 0.1832 | No | ||
| 21 | NEUROD6 | 8638 | 0.183 | 0.1796 | No | ||
| 22 | SMOC1 | 8818 | 0.149 | 0.1729 | No | ||
| 23 | SP5 | 9002 | 0.117 | 0.1653 | No | ||
| 24 | PPP3CB | 9709 | -0.011 | 0.1275 | No | ||
| 25 | H3F3B | 9763 | -0.023 | 0.1251 | No | ||
| 26 | ST5 | 10329 | -0.124 | 0.0971 | No | ||
| 27 | PDZRN3 | 12546 | -0.548 | -0.0116 | No | ||
| 28 | MARK1 | 12829 | -0.605 | -0.0150 | No | ||
| 29 | GAB2 | 12975 | -0.634 | -0.0105 | No | ||
| 30 | IRX5 | 12981 | -0.635 | 0.0015 | No | ||
| 31 | COPS7B | 13089 | -0.658 | 0.0086 | No | ||
| 32 | ARHGAP5 | 13425 | -0.730 | 0.0047 | No | ||
| 33 | SNRPD1 | 13620 | -0.774 | 0.0093 | No | ||
| 34 | SLC12A5 | 14090 | -0.891 | 0.0013 | No | ||
| 35 | PIM1 | 14109 | -0.895 | 0.0178 | No | ||
| 36 | NFAT5 | 14909 | -1.109 | -0.0037 | No | ||
| 37 | RBBP6 | 15093 | -1.161 | 0.0090 | No | ||
| 38 | GABRB3 | 15247 | -1.203 | 0.0241 | No | ||
| 39 | BCORL1 | 15254 | -1.205 | 0.0472 | No | ||
| 40 | TBX2 | 16008 | -1.473 | 0.0352 | No | ||
| 41 | AFF3 | 16257 | -1.568 | 0.0523 | No | ||
| 42 | NCOA6 | 16613 | -1.736 | 0.0669 | No | ||
| 43 | DCC | 17178 | -2.105 | 0.0774 | No |
