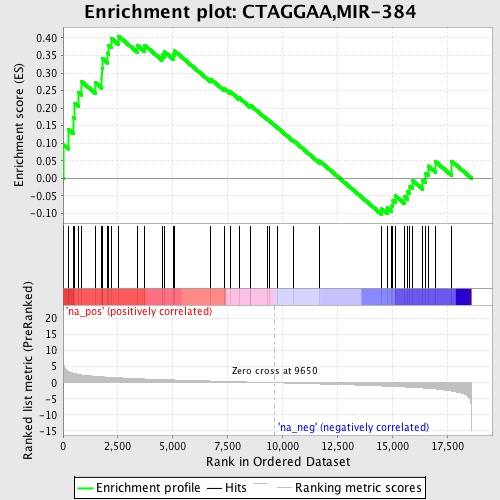
Profile of the Running ES Score & Positions of GeneSet Members on the Rank Ordered List
| Dataset | set04_transDMproB_versus_LMproB |
| Phenotype | NoPhenotypeAvailable |
| Upregulated in class | na_pos |
| GeneSet | CTAGGAA,MIR-384 |
| Enrichment Score (ES) | 0.40516558 |
| Normalized Enrichment Score (NES) | 1.478262 |
| Nominal p-value | 0.031460673 |
| FDR q-value | 1.0 |
| FWER p-Value | 0.994 |
| PROBE | GENE SYMBOL | GENE_TITLE | RANK IN GENE LIST | RANK METRIC SCORE | RUNNING ES | CORE ENRICHMENT | |
|---|---|---|---|---|---|---|---|
| 1 | PTGER2 | 22 | 6.177 | 0.0954 | Yes | ||
| 2 | THBD | 245 | 3.553 | 0.1389 | Yes | ||
| 3 | GTF2B | 460 | 2.960 | 0.1737 | Yes | ||
| 4 | CUGBP2 | 539 | 2.833 | 0.2137 | Yes | ||
| 5 | PICALM | 712 | 2.578 | 0.2448 | Yes | ||
| 6 | BRE | 855 | 2.421 | 0.2750 | Yes | ||
| 7 | ATP2C1 | 1476 | 1.984 | 0.2726 | Yes | ||
| 8 | ERBB2IP | 1771 | 1.835 | 0.2854 | Yes | ||
| 9 | SFRS7 | 1772 | 1.835 | 0.3141 | Yes | ||
| 10 | EPC2 | 1810 | 1.819 | 0.3406 | Yes | ||
| 11 | UNC5C | 2038 | 1.709 | 0.3550 | Yes | ||
| 12 | CD200 | 2081 | 1.693 | 0.3792 | Yes | ||
| 13 | AQP4 | 2209 | 1.646 | 0.3981 | Yes | ||
| 14 | EXOC5 | 2525 | 1.536 | 0.4052 | Yes | ||
| 15 | PTN | 3380 | 1.264 | 0.3789 | No | ||
| 16 | MOSPD1 | 3709 | 1.165 | 0.3795 | No | ||
| 17 | NCAM1 | 4509 | 0.976 | 0.3517 | No | ||
| 18 | SLC35F1 | 4629 | 0.952 | 0.3602 | No | ||
| 19 | CHES1 | 5016 | 0.868 | 0.3530 | No | ||
| 20 | DDX3X | 5080 | 0.857 | 0.3630 | No | ||
| 21 | GPR83 | 6726 | 0.532 | 0.2827 | No | ||
| 22 | CHRD | 7356 | 0.409 | 0.2552 | No | ||
| 23 | SLC39A14 | 7622 | 0.362 | 0.2466 | No | ||
| 24 | ELL3 | 8026 | 0.286 | 0.2294 | No | ||
| 25 | POM121 | 8518 | 0.205 | 0.2061 | No | ||
| 26 | IL17RC | 8554 | 0.199 | 0.2074 | No | ||
| 27 | PRKACB | 9310 | 0.065 | 0.1677 | No | ||
| 28 | GPM6B | 9424 | 0.046 | 0.1624 | No | ||
| 29 | SIX4 | 9759 | -0.023 | 0.1447 | No | ||
| 30 | LAMC1 | 10477 | -0.153 | 0.1085 | No | ||
| 31 | RIMS4 | 11688 | -0.384 | 0.0494 | No | ||
| 32 | GFRA2 | 14521 | -1.008 | -0.0874 | No | ||
| 33 | METAP2 | 14773 | -1.073 | -0.0841 | No | ||
| 34 | HAO1 | 14987 | -1.132 | -0.0779 | No | ||
| 35 | ACVR1 | 15033 | -1.143 | -0.0624 | No | ||
| 36 | YY1 | 15140 | -1.176 | -0.0498 | No | ||
| 37 | RIMS2 | 15573 | -1.314 | -0.0525 | No | ||
| 38 | ARFIP2 | 15706 | -1.355 | -0.0384 | No | ||
| 39 | NLK | 15807 | -1.393 | -0.0220 | No | ||
| 40 | ESRRG | 15942 | -1.448 | -0.0066 | No | ||
| 41 | HDGF | 16393 | -1.626 | -0.0055 | No | ||
| 42 | UBE2E3 | 16533 | -1.697 | 0.0136 | No | ||
| 43 | SYTL2 | 16643 | -1.753 | 0.0351 | No | ||
| 44 | VDP | 16977 | -1.941 | 0.0475 | No | ||
| 45 | DCTN5 | 17713 | -2.604 | 0.0486 | No |
