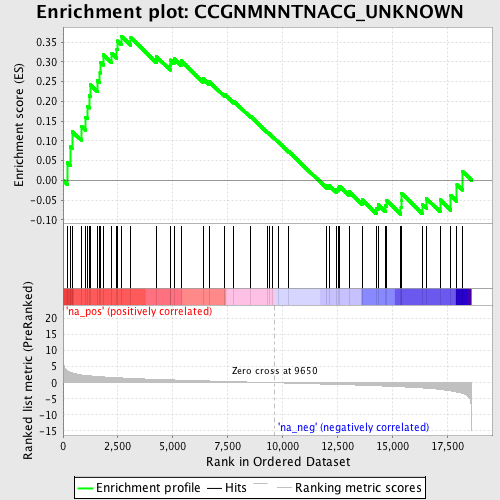
Profile of the Running ES Score & Positions of GeneSet Members on the Rank Ordered List
| Dataset | set04_transDMproB_versus_LMproB |
| Phenotype | NoPhenotypeAvailable |
| Upregulated in class | na_pos |
| GeneSet | CCGNMNNTNACG_UNKNOWN |
| Enrichment Score (ES) | 0.36515254 |
| Normalized Enrichment Score (NES) | 1.3671273 |
| Nominal p-value | 0.0498008 |
| FDR q-value | 0.9888018 |
| FWER p-Value | 1.0 |
| PROBE | GENE SYMBOL | GENE_TITLE | RANK IN GENE LIST | RANK METRIC SCORE | RUNNING ES | CORE ENRICHMENT | |
|---|---|---|---|---|---|---|---|
| 1 | ZCCHC9 | 189 | 3.767 | 0.0442 | Yes | ||
| 2 | CNOT4 | 323 | 3.291 | 0.0845 | Yes | ||
| 3 | WDR1 | 410 | 3.047 | 0.1239 | Yes | ||
| 4 | MRRF | 823 | 2.465 | 0.1373 | Yes | ||
| 5 | ELK4 | 1016 | 2.281 | 0.1599 | Yes | ||
| 6 | MRPL40 | 1100 | 2.224 | 0.1875 | Yes | ||
| 7 | BZW1 | 1185 | 2.170 | 0.2143 | Yes | ||
| 8 | AP1M1 | 1247 | 2.129 | 0.2418 | Yes | ||
| 9 | TIMM8A | 1571 | 1.933 | 0.2523 | Yes | ||
| 10 | CYCS | 1680 | 1.874 | 0.2735 | Yes | ||
| 11 | SPINK2 | 1717 | 1.861 | 0.2984 | Yes | ||
| 12 | SDF2 | 1843 | 1.803 | 0.3177 | Yes | ||
| 13 | HIRA | 2223 | 1.641 | 0.3210 | Yes | ||
| 14 | RBM18 | 2452 | 1.562 | 0.3312 | Yes | ||
| 15 | TXN2 | 2468 | 1.556 | 0.3529 | Yes | ||
| 16 | DIABLO | 2644 | 1.502 | 0.3652 | Yes | ||
| 17 | BMP2K | 3089 | 1.353 | 0.3608 | No | ||
| 18 | CRK | 4256 | 1.037 | 0.3129 | No | ||
| 19 | TAF11 | 4884 | 0.895 | 0.2921 | No | ||
| 20 | RFC4 | 4891 | 0.894 | 0.3047 | No | ||
| 21 | HSPE1 | 5057 | 0.861 | 0.3082 | No | ||
| 22 | GRWD1 | 5377 | 0.792 | 0.3025 | No | ||
| 23 | UBE2H | 6378 | 0.595 | 0.2572 | No | ||
| 24 | KCNN2 | 6657 | 0.544 | 0.2501 | No | ||
| 25 | CHRD | 7356 | 0.409 | 0.2184 | No | ||
| 26 | SPRY2 | 7781 | 0.334 | 0.2003 | No | ||
| 27 | GNB2 | 8542 | 0.200 | 0.1623 | No | ||
| 28 | PRKACB | 9310 | 0.065 | 0.1219 | No | ||
| 29 | GPM6B | 9424 | 0.046 | 0.1165 | No | ||
| 30 | CCBL1 | 9525 | 0.028 | 0.1115 | No | ||
| 31 | ADCK4 | 9798 | -0.029 | 0.0973 | No | ||
| 32 | HTATIP | 10286 | -0.118 | 0.0728 | No | ||
| 33 | ARHGEF7 | 12014 | -0.443 | -0.0139 | No | ||
| 34 | SYT6 | 12141 | -0.469 | -0.0139 | No | ||
| 35 | ITPKC | 12454 | -0.531 | -0.0230 | No | ||
| 36 | HIP1 | 12532 | -0.545 | -0.0193 | No | ||
| 37 | ZBTB11 | 12594 | -0.558 | -0.0145 | No | ||
| 38 | FOSB | 13036 | -0.648 | -0.0289 | No | ||
| 39 | THPO | 13627 | -0.777 | -0.0495 | No | ||
| 40 | DDX50 | 14278 | -0.940 | -0.0709 | No | ||
| 41 | MARK3 | 14356 | -0.964 | -0.0612 | No | ||
| 42 | RPS27 | 14700 | -1.052 | -0.0645 | No | ||
| 43 | CAD | 14740 | -1.064 | -0.0512 | No | ||
| 44 | SYNCRIP | 15399 | -1.253 | -0.0686 | No | ||
| 45 | SFRS10 | 15407 | -1.258 | -0.0508 | No | ||
| 46 | FBXO8 | 15411 | -1.260 | -0.0328 | No | ||
| 47 | PPT2 | 16387 | -1.622 | -0.0619 | No | ||
| 48 | CANX | 16554 | -1.704 | -0.0462 | No | ||
| 49 | RNF44 | 17184 | -2.109 | -0.0496 | No | ||
| 50 | HSPD1 | 17674 | -2.569 | -0.0389 | No | ||
| 51 | SUPT6H | 17950 | -2.911 | -0.0117 | No | ||
| 52 | HMG20B | 18195 | -3.290 | 0.0227 | No |
