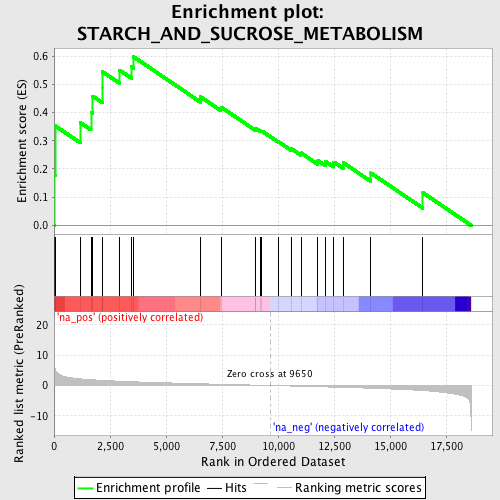
Profile of the Running ES Score & Positions of GeneSet Members on the Rank Ordered List
| Dataset | set04_transDMproB_versus_LMproB |
| Phenotype | NoPhenotypeAvailable |
| Upregulated in class | na_pos |
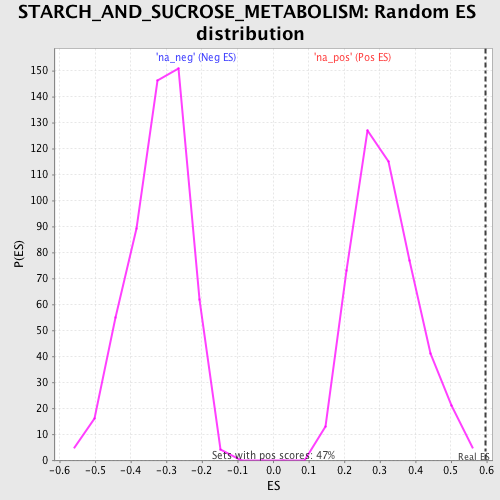
| GeneSet | STARCH_AND_SUCROSE_METABOLISM |
| Enrichment Score (ES) | 0.5974442 |
| Normalized Enrichment Score (NES) | 1.8904148 |
| Nominal p-value | 0.0 |
| FDR q-value | 0.050872214 |
| FWER p-Value | 0.271 |
| PROBE | GENE SYMBOL | GENE_TITLE | RANK IN GENE LIST | RANK METRIC SCORE | RUNNING ES | CORE ENRICHMENT | |
|---|---|---|---|---|---|---|---|
| 1 | UGT1A6 | 37 | 5.468 | 0.1785 | Yes | ||
| 2 | UGT1A10 | 46 | 5.299 | 0.3529 | Yes | ||
| 3 | PYGL | 1173 | 2.176 | 0.3642 | Yes | ||
| 4 | HK2 | 1648 | 1.891 | 0.4011 | Yes | ||
| 5 | MGAM | 1728 | 1.852 | 0.4580 | Yes | ||
| 6 | GANAB | 2152 | 1.664 | 0.4901 | Yes | ||
| 7 | ENPP1 | 2154 | 1.663 | 0.5450 | Yes | ||
| 8 | PYGB | 2915 | 1.412 | 0.5507 | Yes | ||
| 9 | HK3 | 3456 | 1.240 | 0.5626 | Yes | ||
| 10 | PGM1 | 3550 | 1.208 | 0.5974 | Yes | ||
| 11 | PGM3 | 6534 | 0.568 | 0.4558 | No | ||
| 12 | GBE1 | 7450 | 0.391 | 0.4195 | No | ||
| 13 | SI | 8984 | 0.119 | 0.3409 | No | ||
| 14 | GCK | 8991 | 0.118 | 0.3445 | No | ||
| 15 | UCHL3 | 9222 | 0.081 | 0.3348 | No | ||
| 16 | UCHL1 | 9275 | 0.070 | 0.3343 | No | ||
| 17 | UGDH | 10013 | -0.069 | 0.2970 | No | ||
| 18 | GYS1 | 10592 | -0.175 | 0.2716 | No | ||
| 19 | HK1 | 11021 | -0.249 | 0.2568 | No | ||
| 20 | PYGM | 11778 | -0.401 | 0.2294 | No | ||
| 21 | GAA | 12124 | -0.465 | 0.2262 | No | ||
| 22 | GYS2 | 12482 | -0.536 | 0.2247 | No | ||
| 23 | G6PC | 12900 | -0.620 | 0.2227 | No | ||
| 24 | UXS1 | 14141 | -0.904 | 0.1858 | No | ||
| 25 | ENPP3 | 16464 | -1.661 | 0.1157 | No |