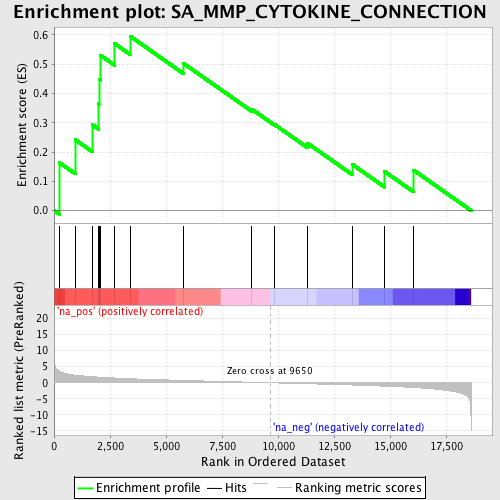
Profile of the Running ES Score & Positions of GeneSet Members on the Rank Ordered List
| Dataset | set04_transDMproB_versus_LMproB |
| Phenotype | NoPhenotypeAvailable |
| Upregulated in class | na_pos |
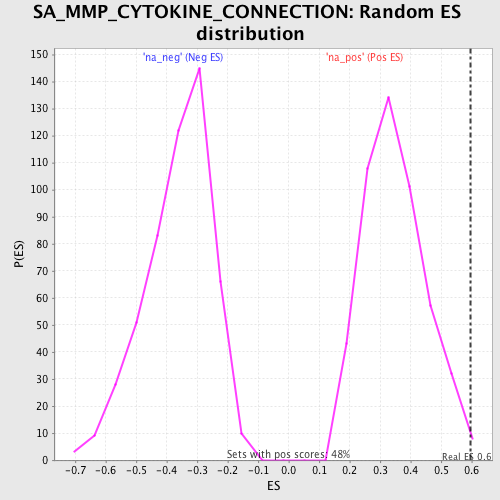
| GeneSet | SA_MMP_CYTOKINE_CONNECTION |
| Enrichment Score (ES) | 0.595929 |
| Normalized Enrichment Score (NES) | 1.7036859 |
| Nominal p-value | 0.0062111802 |
| FDR q-value | 0.1880262 |
| FWER p-Value | 0.874 |
| PROBE | GENE SYMBOL | GENE_TITLE | RANK IN GENE LIST | RANK METRIC SCORE | RUNNING ES | CORE ENRICHMENT | |
|---|---|---|---|---|---|---|---|
| 1 | SELL | 249 | 3.543 | 0.1630 | Yes | ||
| 2 | ACE | 947 | 2.338 | 0.2418 | Yes | ||
| 3 | TNFRSF1B | 1721 | 1.858 | 0.2927 | Yes | ||
| 4 | SPN | 1993 | 1.729 | 0.3642 | Yes | ||
| 5 | TNFRSF1A | 2006 | 1.721 | 0.4492 | Yes | ||
| 6 | IL1B | 2070 | 1.697 | 0.5303 | Yes | ||
| 7 | FCGR3A | 2692 | 1.487 | 0.5709 | Yes | ||
| 8 | IL6R | 3392 | 1.259 | 0.5959 | Yes | ||
| 9 | CD44 | 5789 | 0.706 | 0.5022 | No | ||
| 10 | TNFRSF8 | 8832 | 0.146 | 0.3460 | No | ||
| 11 | TGFB2 | 9851 | -0.042 | 0.2933 | No | ||
| 12 | CSF1 | 11302 | -0.306 | 0.2306 | No | ||
| 13 | TGFB1 | 13308 | -0.704 | 0.1578 | No | ||
| 14 | TNFSF8 | 14750 | -1.068 | 0.1335 | No | ||
| 15 | TNF | 16052 | -1.492 | 0.1378 | No |