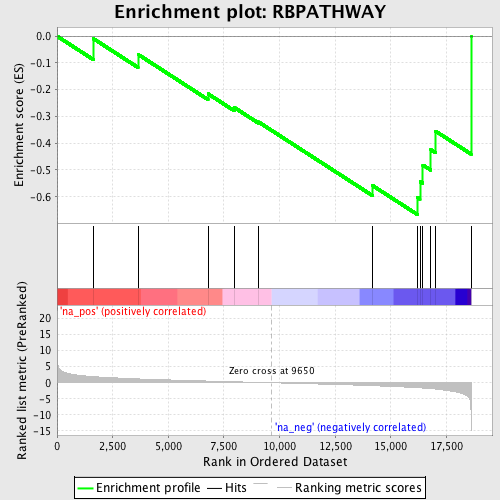
Profile of the Running ES Score & Positions of GeneSet Members on the Rank Ordered List
| Dataset | set04_transDMproB_versus_LMproB |
| Phenotype | NoPhenotypeAvailable |
| Upregulated in class | na_neg |
| GeneSet | RBPATHWAY |
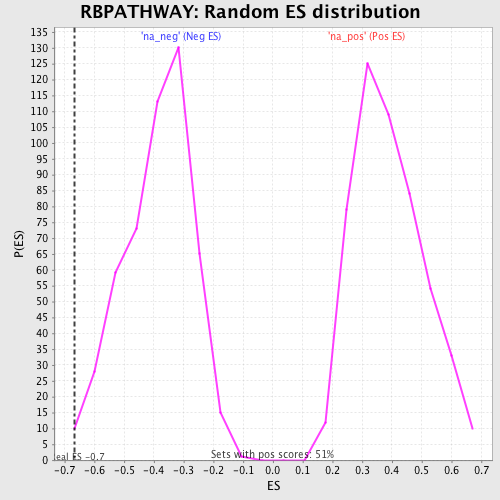
| Enrichment Score (ES) | -0.66632545 |
| Normalized Enrichment Score (NES) | -1.7153937 |
| Nominal p-value | 0.0060728746 |
| FDR q-value | 0.33219343 |
| FWER p-Value | 0.868 |
| PROBE | GENE SYMBOL | GENE_TITLE | RANK IN GENE LIST | RANK METRIC SCORE | RUNNING ES | CORE ENRICHMENT | |
|---|---|---|---|---|---|---|---|
| 1 | YWHAH | 1639 | 1.895 | -0.0097 | No | ||
| 2 | ATM | 3638 | 1.186 | -0.0680 | No | ||
| 3 | CHEK1 | 6785 | 0.522 | -0.2155 | No | ||
| 4 | RB1 | 7963 | 0.297 | -0.2665 | No | ||
| 5 | WEE1 | 9051 | 0.108 | -0.3204 | No | ||
| 6 | MYT1 | 14175 | -0.913 | -0.5580 | No | ||
| 7 | CDK4 | 16191 | -1.548 | -0.6023 | Yes | ||
| 8 | CDK2 | 16312 | -1.588 | -0.5430 | Yes | ||
| 9 | CDC25B | 16441 | -1.655 | -0.4814 | Yes | ||
| 10 | CDC25A | 16797 | -1.837 | -0.4245 | Yes | ||
| 11 | CDC25C | 17009 | -1.959 | -0.3548 | Yes | ||
| 12 | TP53 | 18610 | -10.661 | 0.0003 | Yes |